 RSS Feed
 by Calculated Risk on 12/14/2006 12:20:00 PM
Thursday, December 14, 2006
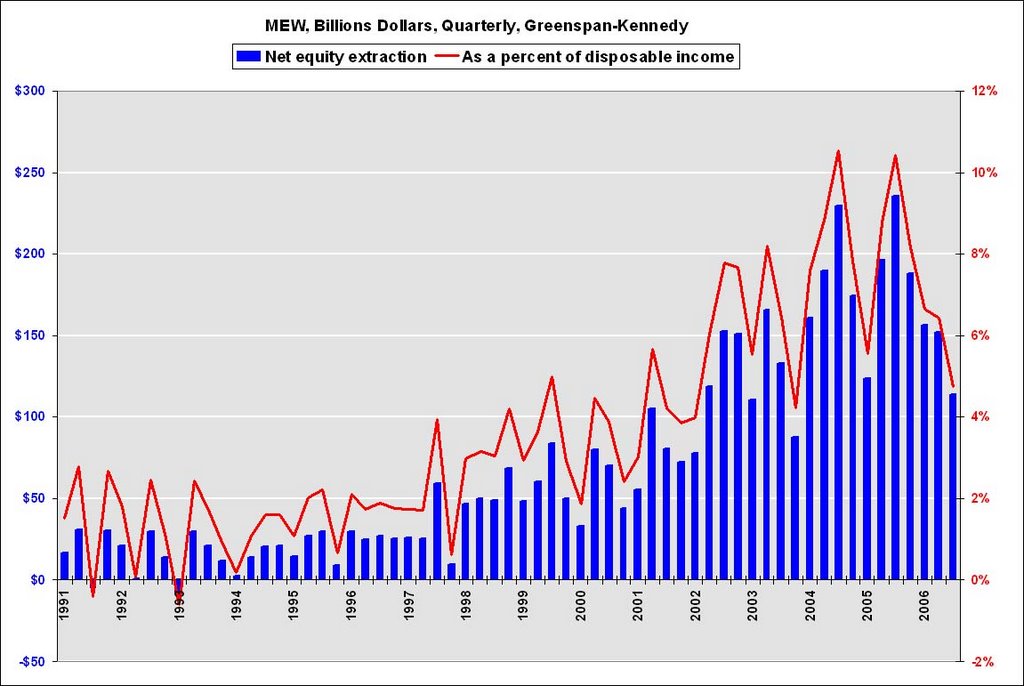
Greenspan-Kennedy MEW Graph
 Click on graph for larger image.
Here is a graph of the Greenspan-Kennedy MEW results, both in billions of dollars quarterly (not annual rate), and as a percent of personal disposable income.


