 RSS Feed
 by Calculated Risk on 11/03/2006 02:02:00 PM
Friday, November 03, 2006
FDIC: Economic Conditions and Emerging Risks in Banking
The FDIC Semiannual Report: Economic Conditions and Emerging Risks in Banking has been released. The report identifies several risks: declining Net Interest Margins because of the inverted yield curve, the housing market in general and sub-prime lending specifically, looser lending standards and concentration risk - especially for mid-sized institutions - in commercial real estate (CRE) and construction & development (C&D).
Before noting the negative comments, the FDIC outlook is the same as the consensus: a soft landing. Click on graph for larger image.
GDP is expected to grow at a rate below its long-run average over the next year due to the combination of a slowing housing market, continued high energy prices, slowing production in the auto industry, and lagged effects of previous interest rate increases. However, the corporate sector continues to perform well. Corporate profits currently make up more than 12 percent of GDP—the highest proportion since the 1960s—and grew more than 20 percent in the twelve months to June 30, 2006. Corporate balance sheets are also strong and reflect a debt-to-net-worth ratio for the second quarter of just over 40 percent, the lowest point since the mid-1980s.The FDIC expressed concern about households:
Household liabilities, on the other hand, reached an all-time high of more than 19 percent of assets by the end of the second quarter 2006, as the personal saving rate has fallen into negative territory for five consecutive quarters. Housing-related debt service costs are at all-time highs, and use of home equity loans has slowed sharply as the effects of recent interest rate increases set in.The second graph shows declining Net Interest Margins (NIMs) due to the inverted yield curve:

... the Treasury yield curve, which exhibited a small positive slope at the time of our last report, is currently more inverted than at any point since 2001. The inverted yield curve is pressuring lending institutions, which tend to have liabilities priced according to short-term interest rates and assets priced according to long-term interest rates. As a result, NIMs have fallen, particularly at large institutions, whose liabilities are more elastic than smaller banks’ due to their smaller percentage of core deposits. Four of six Regional Risk Committees cited interest rate risk as a potential concern due to the flat-to-inverted yield curve and narrowing margins.After reviewing the "softening housing market", the FDIC expressed concern about nontraditional mortages:
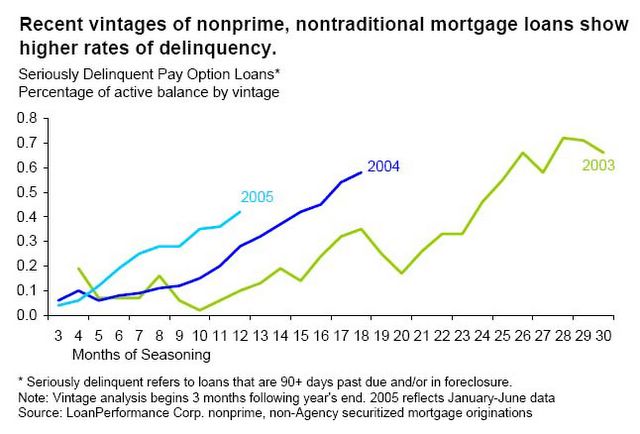
It is very likely that both delinquency and foreclosure rates will rise if the housing slowdown deepens. The first fault lines likely to appear in mortgage credit performance would be among highly leveraged, variable rate borrowers who have stretched their financial resources to purchase a home during the recent housing boom. Five of six Regional Risk Committees reported some level of concern about future performance of prime residential loans due to slowing home price appreciation.
There are emerging signs of potential credit distress among holders of subprime adjustable-rate mortgages (ARMs). Nationwide, foreclosures started on subprime ARMs made up 2.0 percent of loans in the second quarter, up from 1.3 percent in mid-2004. Subprime ARMs are experiencing stress in states as diverse as California, which has had rapid home price gains and solid economic performance, and Michigan, where house prices have been stagnant and the economy is weaker. This suggests that national factors, like interest rate increases, are important factors behind subprime mortgage credit stress, in addition to local economic or housing market conditions.
Certain household-sector developments that have emerged during the recent housing boom could potentially amplify the adverse effects of a housing slowdown. These developments include: (1) a negative personal saving rate and unprecedented levels of home equity liquidation, (2) a greater degree of homeowner leverage, and (3) much broader use of so-called alternative mortgage products, including interest-only and payment option mortgages. With household finances already under pressure from high financial obligation ratios, these developments may place homeowners in a more tenuous position than has been the case prior to previous periods of housing weakness.And another area of concern is the concentration of loans for CRE and C&D:
Small and mid-size institutions have been increasing their concentrations in riskier assets, such as CRE loans and construction and development (C&D) loans. This suggests that, although small and mid-size institutions have been more successful in limiting the erosion of their nominal NIMs, they have achieved this success in part by assuming higher levels of credit risk.
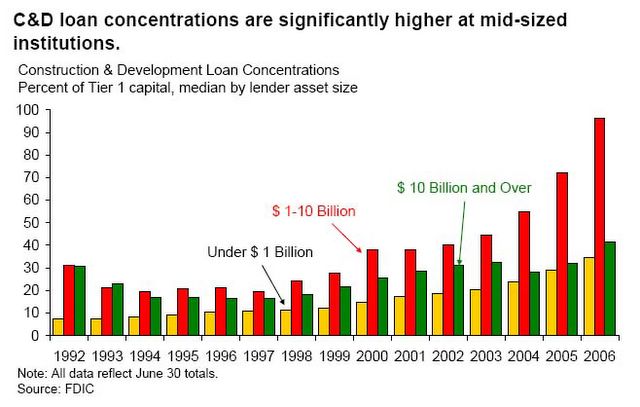
... continued increases in concentrations and reports of loosened underwriting standards at FDIC-insured institutions signal the potential for future credit quality deterioration. In addition, regulators have noted increasing C&D and overall CRE loan
concentrations, especially at institutions with total assets between $1 billion and $10 billion. Four of six Regional Risk Committees expressed some level of concern about CRE lending, in part due to continuing increases in concentrations.
October Employment Report
by Calculated Risk on 11/03/2006 08:59:00 AM
The BLS reports: U.S. nonfarm payrolls climbed by 92,000 in September, after a revised 148,000 gain in August, and the unemployment rate fell to 4.4% in October from 4.6% in September.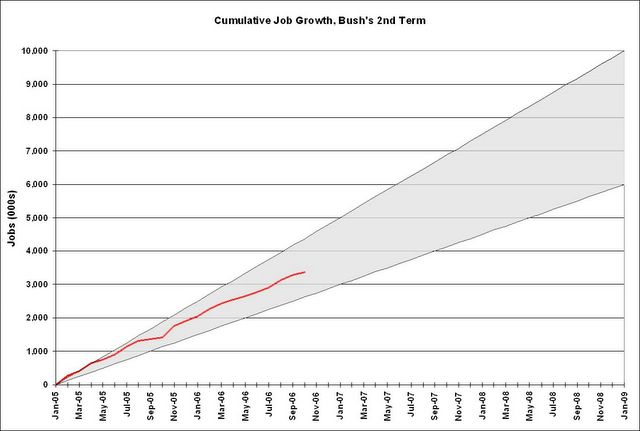 Click on graph for larger image.
Here is the cumulative nonfarm job growth for Bush's 2nd term. The gray area represents the expected job growth (from 6 million to 10 million jobs over the four year term). Job growth is about in the middle of the expected range.
The following two graphs are the areas I've been watching closely: residential construction and retail employment.
Residential construction employment decreased by 31,600 jobs in October and is down 93.2 thousand, or about 2.8%, from the peak in February. This is the beginning of the loss of several hundred thousand residential construction jobs over the next year or so.
Note the scale doesn't start from zero: this is to better show the change in employment.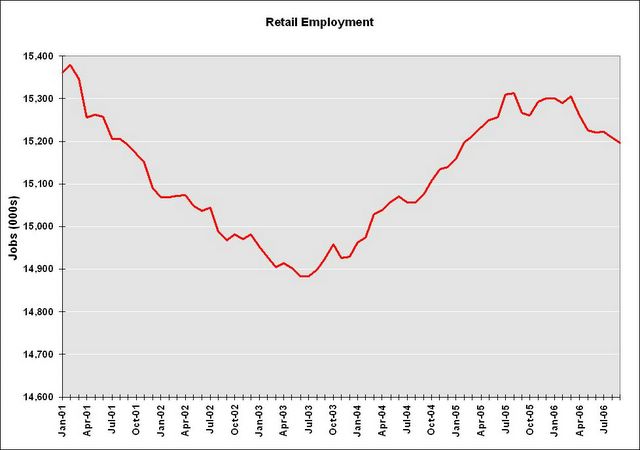
Retail employment declined 3,500 jobs in October. The YoY change in retail employment is now -0.4%.
The YoY decrease in retail employment is concerning: see Retail Employment
Overall, the upwards revision to the August and September reports more than offset the weak October report, and the unemployment rate decreased to 4.4%.
The expected job losses in residential construction employment has started in earnest. I expect the rate of losses to continue to increase over the coming months.
Thursday, November 02, 2006
Roubini: 90% Chance of Recession
by Calculated Risk on 11/02/2006 07:01:00 PM
A few excerpts from Bloomberg: U.S. Recession Warnings Grow Louder; Some Say It's Just Noise.
Professor Roubini had put the odds of a recession at 70%, now he is even more pessimistic:
"We're already at the tipping point," said Nouriel Roubini, chairman of Roubini Global Economics LLC in New York and a professor of economics at New York University. "The weakness is spilling over from housing to the auto sector to manufacturing to retail. We're at a 90 percent probability of a recession."And a few other bearish views:
David Rosenberg, Merrill Lynch & Co.'s New York-based chief North American economist yesterday said the economy is ``on a knife's edge,'' while hedge fund manager Jim Rogers told a news conference in Seoul today that the U.S. ``is in recession right now.''And the bullish view:
...
Martin Baily, chairman of the Council of Economic Advisers under President Bill Clinton, puts the possibility of a recession at ``about a third'' and calls that ``significant.''
``We should view this slowdown as very welcome,'' said [economist Steve] Wieting, director of economic and market analysis at Citigroup in New York. ``Recessions are built on complete excess. We had that in housing, but we didn't have that in the broader economy.''
...
Lehman's [John] Shin says recession chances are nowhere near [90%] ``The two main fundamentals in the economy, consumer spending and business spending, have held up fairly well,''
Fed's Fisher: Housing Bust Complicates Fed's Task
by Calculated Risk on 11/02/2006 12:48:00 PM
Dallas Fed President Richard W. Fisher spoke today in New York: Confessions of a Data Dependent
In retrospect, [in 2002 and 2003] the real fed funds rate turned out to be lower than what was deemed appropriate at the time and was held lower longer that it should have been. In this case, poor data led to a policy action that amplified speculative activity in the housing and other markets. Today, as anybody not from the former planet of Pluto knows, the housing market is undergoing a substantial correction and inflicting real costs to millions of homeowners across the country. It is complicating the task of achieving our monetary objective of creating the conditions for sustainable non-inflationary growth.
Unemployment Claims and Recessions
by Calculated Risk on 11/02/2006 10:35:00 AM
Last week Tim Duy commented on the current Fed thinking:
"I believe the risk of a hard landing is not insignificant, but recent data does not point in that direction. We are not seeing the hallmarks of a hard landing such as collapsing core durable goods orders, rising jobless claims, or plummeting consumer confidence. Without those signals, the Fed will stick to the soft landing story. Consequently, the Fed is not likely to view 3Q06 report as disastrous; they will view as in line with their expectations." emphasis added.Here is a look at weekly unemployment claims and recessions - from the Dept of Labor:
In the week ending Oct. 28, the advance figure for seasonally adjusted initial claims was 327,000, an increase of 18,000 from the previous week's revised figure of 309,000. The 4-week moving average was 311,250, an increase of 5,750 from the previous week's revised average of 305,500.
 Click on graph for larger image.
This graph shows the 4-week moving average of weekly unemployment claims vs. Recessions. Usually claims are rising prior to the onset of a recession.
For the 2001 recession, claims were just above 300K per week in early November 2000, and the recession started in March 2001. This is something to watch, however there is a question of how many construction workers will be eligible for unemployment, since many are "cash workers" or individual sub-contractors - so unemployment claims might not be as good a leading indicator of a housing led recession, compared to prior recessions.
Wednesday, November 01, 2006
Fiscal 2007: National Debt increases $77.4 Billion in October
by Calculated Risk on 11/01/2006 08:54:00 PM
The Federal Government's fiscal year 2007 started on October 1st. The good news is the National Debt only increased $77.4 Billion in October.
The bad news is that is the third worst October ever. Click on graph for larger image.
Estimates from CBO are for the budget deficit to increase in fiscal 2007, as compared to 2006. Of course the CBO projections are based on 4.2% GDP growth in Q4 2006, and 3.0% GDP growth in calendar 2007.
I suspect growth will be below the CBO estimates and the General Fund deficit will probably be larger than their current projection of $471 Billion for fiscal 2007. If the economy slows, the National Debt will probably increase by $600 Billion or more this year.
Limit on GSE-eligible mortgages may decline for '07
by Calculated Risk on 11/01/2006 04:36:00 PM
From Reuters: Limit on GSE-eligible mortgages may decline for '07
Declining home values in 2006 may reduce the size of loans eligible for purchase by Fannie Mae and Freddie Mac, raising consumer borrowing costs in some high-priced regions, analysts said.
The so-called "conforming" loan limit is based on home prices in the Federal Housing Finance Board's Monthly Interest Rate Survey, which have declined 3.1 percent in the 12 months through September. The limit for 2007 will be calculated upon release of October data on Nov. 28.
...
The loan limit has not declined since falling by $150 in 1990 to $187,450. Its 15.9 percent jump for 2006 more than doubled the average rise during the decade-long housing boom.
Loan limits are set with Federal Housing Finance Board data by the Office of Federal Housing Enterprise Oversight (OFHEO), the regulator of Fannie Mae and Freddie Mac. It is unclear whether OFHEO has discretion over its model in setting the loan limits, analysts said.
"We believe that if OFHEO follows its procedures strictly to the letter, there will be a small decline in the conforming loan limit for 2007," UBS analysts said in a research note.
Cash-out refinancing Strong in Q3
by Calculated Risk on 11/01/2006 04:16:00 PM
From Reuters: Cash-out refinancing hits 16-yr peak in Q3-Freddie
U.S. homeowners took cash out of their homes in the third quarter at the highest rate in 16 years, spurred by high costs on other types of loans, according to home finance company Freddie Mac.
In the quarter, 89 percent of Freddie Mac-owned loans that refinanced got mortgages that were at least 5 percent larger than the original balances. That compared with 88 percent in the prior quarter and was the highest level since the second quarter of 1990, when it was at 91 percent.
The total amount refinanced, however, fell in the third quarter.
...
Homeowners tapped into their home equity for $82.8 billion in cash in the third quarter, compared with a revised $90.6 billion in the prior quarter. The amount could slide below $65 billion in the fourth quarter, according to Freddie Mac.
Homeowners taking less advantage of home equity wealth could have a significant ripple effect on the economy, if consumers borrower and spend less, analysts have said.
...
Half of the borrowers who paid off their original loan and took out a larger new one increased their mortgage rate by about 3/8 percentage point, Freddie Mac said.
The median ratio of new-to-old interest rates was the highest since Freddie began compiling the information in 1985.
MBA: Mortgage Rates and Applications Decline
by Calculated Risk on 11/01/2006 12:28:00 AM
The Mortgage Bankers Association (MBA) reports: Mortgage Rates and Applications Decline
The MBA Purchase Index is at the lowest level since 2003.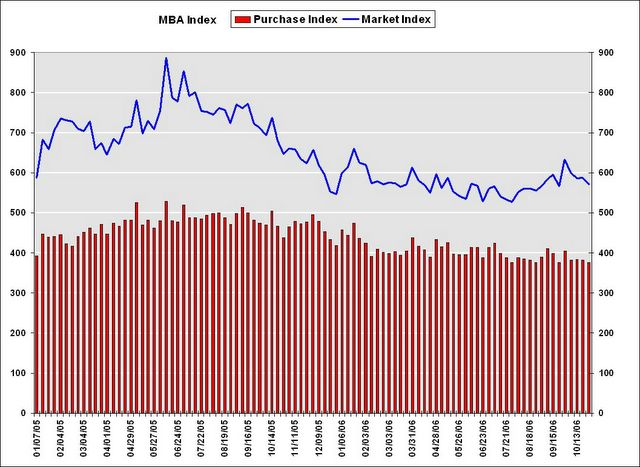 Click on graph for larger image.
The Market Composite Index, a measure of mortgage loan application volume, was 570.8, a decrease of 3 percent on a seasonally adjusted basis from 588.6 one week earlier. On an unadjusted basis, the Index decreased 3.3 percent compared with the previous week and was down 11.2 percent compared with the same week one year earlier.Mortgage rates decreased:
The seasonally-adjusted Refinance Index decreased by 4.5 percent to 1709.2 from 1790.4 the previous week and the Purchase Index decreased by 1.8 percent to 375.6 from 382.4 one week earlier.
The average contract interest rate for 30-year fixed-rate mortgages decreased to 6.24 percent from 6.36 percent ...
The average contract interest rate for one-year ARMs decreased to 5.93 percent from 5.97 percent ...
 The second graph shows the Purchase Index and the 4 and 12 week moving averages since January 2002.
The four week moving average for the seasonally-adjusted Market Index is down 2.6 percent to 586.1 from 601.9. The four week moving average is down 1.9 percent to 381.5 from 388.8 for the Purchase Index, while this average is down 3.5 percent to 1778.7 from 1844.1 for the Refinance Index.The 4 week and 12 week moving averages for the Purchase Index are at the lowest levels since 2003. The downtrend in purchase activity is continuing.
Tuesday, October 31, 2006
Northern Trust asks: Housing Recession Isn’t Spreading?
by Calculated Risk on 10/31/2006 05:11:00 PM
Northern Trust's Paul Kasriel writes: Housing Recession Isn't Spreading? Kasriel argues that we may already be seeing spillover from the housing recession into the general economy. A few excerpts: Click on graph for larger image.
Graphs and text from Northern Trust.
"For Q3:2006, the year-over-year change in real consumption was 2.8%, down a full percentage point from its reading of Q3:2005 and the lowest year-over-year growth since the first half of 2003. Perhaps it has nothing to do with the housing recession, but the data say that growth in consumer spending, although not yet collapsing, certainly is decelerating."
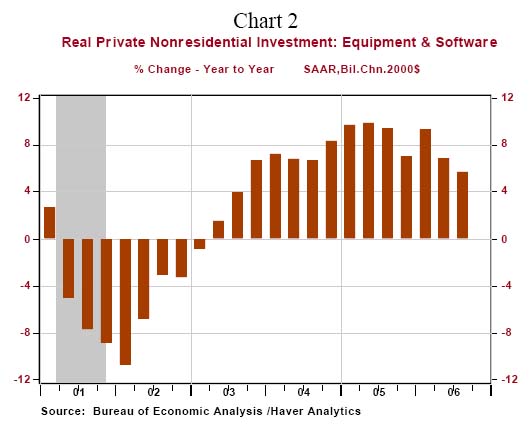
"Now, direct your eyes to Chart 2, which shows the year-over-year percent change in real expenditures of business equipment and software. In Q3:2006, the year-over-year change was 5.7%, down from 9.3% in Q3:2005 and the slowest year-over-year growth since Q3:2003. Again, although there is no recession in business capital spending, yet, the data show very clearly that the growth in spending on business equipment and software is decidedly moderating."Please see the Northern Trust commentary for more.


