 RSS Feed
 by Calculated Risk on 9/13/2005 06:45:00 PM
Tuesday, September 13, 2005
Trade Deficit: Another Look
General Glut and Dr. Setser have some excellent analysis on the trade deficit today. In the comments of General Glut's blog, Vorpal points out that the trade deficit is a record NSA (Not Seasonally Adjusted). Vorpal wrote:
"I wouldn't trust the [seasonal] adjustments because the nature of the deficit is changing so rapidly that historical precedent may be inaccurate."Comment on Seasonal Adjustment: I believe the Census Bureau and the Bureau of Economic Analysis does the best possible job of seasonally adjusting these numbers. Vorpal makes a keen observation; the nature of portions of the deficit are changing rapidly and we need to look at several months worth of data and consider the NSA data too. For a brief description of adjustments, see this post (2nd graph and discussion). Although I didn't discover any apparent problems with the seasonal adjustment, Vorpal's comments did lead me to the following:

Click on graphs for larger images.
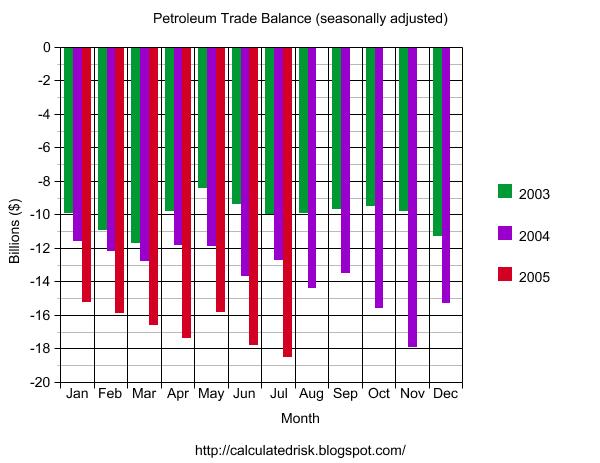
If we break down the NSA imports into three components (petroleum, China, and other) we see something possibly interesting. Petroleum imports are growing significantly and set another record in July.
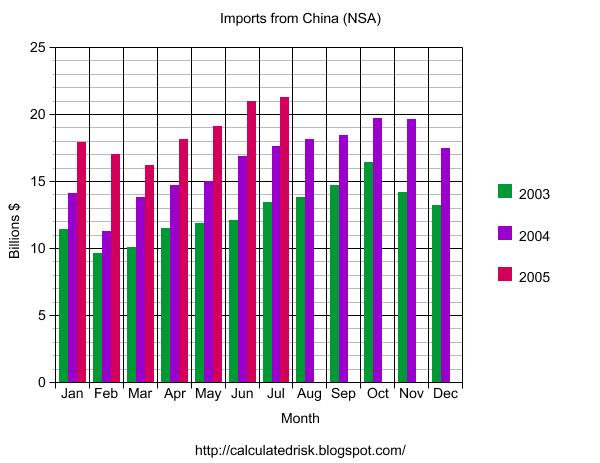
Imports from China also set another record in July. Imports from China follow a clear seasonal pattern and we can expect imports to continue to rise for the next several months.
NOTE: The Long Beach and Los Angeles ports implemented the OffPeak initiative (adds late night hours to port operations) starting on July 23rd to handle the expected heavier late summer / fall imports. I expect August to be a strong month for imports from China.
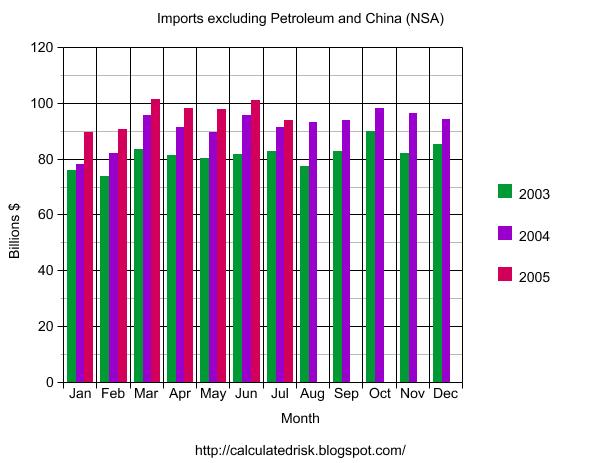
While Petroleum imports and imports from China are setting records, other imports have shown relatively sluggish growth.
Perhaps the relatively weak dollar has slowed imports from other countries.
The final graph shows the trade deficit for goods excluding imports and exports of petroleum and China.
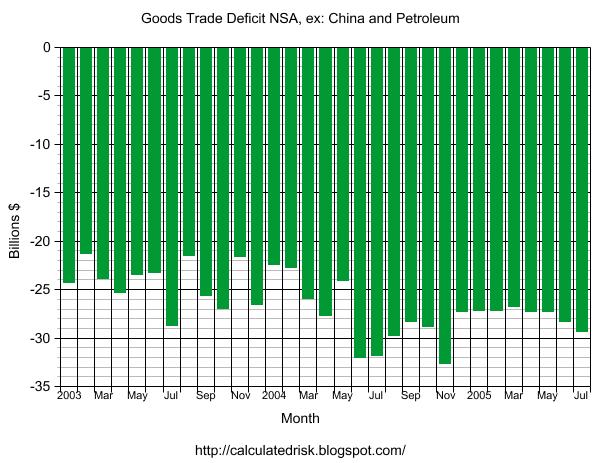
This graph shows that the "other" goods trade deficit (excluding services, and goods with China and Petroleum) peaked last summer. Perhaps that is why the dollar stopped falling earlier this year. Unfortunately it appears the "other" deficit is starting to climb again, and combined with more NSA records for China and petroleum products, I expect record SA trade deficit numbers over the next few months.
O.C. housing price hits $617,000
by Calculated Risk on 9/13/2005 11:35:00 AM
The OC Register reports:
The median housing selling price hit another record in August – the sixth peak in seven months – at $617,000, DataQuick reported this morning.Back in March I wrote that they were giving away "Free Money" in Orange County. The median price was $555K in March, so the price has increased $62K in 5 months (11%). OC Realtor Gary Watt's prediction of $70K in gains this year for a median priced home is looking good.
That's up from $601,000 in July and a 13 percent jump from the same month last year when fears were mounting that the local housing market was in trouble.
Sales were brisk in August as 4,708 units were sold. That's a 25 percent jump in pace from August 2004 amid that year's summertime doldrums.
US Trade Deficit: $57.9 Billion for July
by Calculated Risk on 9/13/2005 08:30:00 AM
The U.S. Census Bureau and the U.S. Bureau of Economic Analysis released the monthly trade balance report today for July:
"... total July exports of $106.2 billion and imports of $164.2 billion resulted in a goods and services deficit of $57.9 billion, $1.6 billionNote: all numbers are seasonally adjusted.
less than the $59.5 billion in June, revised.
July exports were $0.4 billion more than June exports of $105.8 billion. July imports were $1.1 billion less than June imports of $165.3 billion."

Click on graph for larger image.
July 2005 was 13% worse than July 2004. For the first seven months of 2005, the trade deficits is up 18% over the same period in 2004.
Imports from China set another record of $21,283 Billion. Imports from Japan were off slightly to $11,363 Billion.
The average contract price for oil set a new record of $49.03 per barrel breaking the old record of $44.76 in April.
The SA petroleum trade deficit set another record of $18.5 Billion.
With record imports from China and a record petroleum deficit, I'm surprised that the overall trade deficit wasn't a record; but it was close. I expect the deficit to widen over the rest of the year.
Monday, September 12, 2005
Oil and Gasoline Confusion
by Calculated Risk on 9/12/2005 06:48:00 PM
A Reuters article, "Oil sinks back near $63", quotes Gary Ross, chief executive of U.S. energy consultancy PIRA Energy, saying:
"U.S. gasoline data over the next few weeks will show the effect of high oil prices on demand."His statement is inaccurate. Gasoline data will show the effect of high gasoline prices on demand. Even with spot oil prices over $60, gasoline demand was still robust until Hurricane Katrina shut down several major refineries causing a supply shock for refined products.
The Financial Times makes a similar mistake:
"One factor driving up [crude oil] prices has been the inability of consuming countries to increase refinement capacity."It is very possible that limitations on refining heavy and/or sour crude have increased the spread between different grades of crude (see Sweet and Sour Crude). However, a general constraint on refining capacity would lead to lower crude prices, not "drive" up the price of crude oil.
This confusion seems to be widespread in the financial media.
Gasoline Update
by Calculated Risk on 9/12/2005 01:11:00 AM
My latest post on Angry Bear is up: Gasoline: A Time for Caution.
And here is an interesting follow on article: Could Katrina kill the SUV?
Even before Hurricane Katrina tore through the southern United States, hampering a big chunk of the US oil industry, consumers were having second thoughts about gas-guzzling sport utility vehicles.The headline is an exaggeration, but the automobile industry was in trouble before the hurricane and it is very possible that consumer preferences will change in response to higher gas prices (just like in the early '80s). The consequences for the automobile manufacturers and the US economy might be significant.
Katrina could now hasten the demise of the SUV, at least in its current guise, after years in which it has ruled the roost over the world's biggest auto market, analysts believe.
...
"Potentially, Katrina could signal the death knell of the SUV in as much as consumers are going to find themselves once burned, twice shy to buy such vehicles," Wachovia economist Jason Schenker said.
"High gas prices and the perceived fragility of the US energy sector are all likely to weigh on consumers' choices for years," he said.
Sales of big SUVs dropped dramatically in August, hurting both American and Japanese manufacturers, which have been trying to edge into the segment over the past five years
Best to all.
Saturday, September 10, 2005
Return from Paradise
by Calculated Risk on 9/10/2005 12:25:00 PM
After a week without news, hopefully I return with a clear head and a fresh look at the world. But first a few photos of Yellowstone ...

Click on photos for larger image.
The Yellowstone river winds its way through the Hayden valley in early September.
The wildlife viewing was excellent. Herds of bison were ubiquitous. We encountered several bull elk herding their harems through the forest. We saw wolves in the Lamar Valley, Pronghorn antelope, moose, coyote, trumpeter swan, mule deer and more. Did I mention the Bison were everywhere? Examining a large petrified Redwood tree stump on Specimen Ridge.
This tree was buried some 50 million years ago by volcanic deposits and mudflows during a volcanic eruption. There are two smaller petrified Redwood trees just below the large Redwood (one in the bright sun, one in the shade). The view and the numerous specimens on the ridge (hence the name) made the steep climb worth the effort.
This Great Gray Owl greeted us on a short walk to the Natural Bridge (a small natural arch near Lake Yellowstone).
The park is incredible. The burn areas from the '88 fire are filling in with new growth and many of the young Lodgepole Pines, in the better growing areas, are 10 to 15 feet tall. I heartily recommend a September visit to Yellowstone.
Best to all and its great to be home!
Friday, September 02, 2005
Some Good News on Oil and Gas
by Calculated Risk on 9/02/2005 04:28:00 PM
NOTE: I will be out of town over the next week (leaving tonight). I hope everyone has a good week ... and my thoughts are with the victims of Hurricane Katrina.
The AP reports: Nations to Release 60M Barrels of Oil, Gas
Twenty-six countries in an international energy consortium will release more than 60 million barrels of crude oil and gasoline to relieve the energy crunch caused by Hurricane Katrina in the United States.This is a short term (30 day) fix since these countries are drawing down reserves to help the US. OCT Crude Oil was down to $67.57 per barrel and unleaded gasoline (OCT) down to $2.18 per gallon on the news.
...
[Energy Secretary Samuel Bodman] said he had received indications from other IEA members that a significant part of their portion would be refined products, mostly gasoline, which will be released onto global markets.
"We have made it known that we are facing shortfalls in available supplies of refined products in our country as a consequence of this storm," Bodman said, expressing confidence the gasoline will find its way to the United States where prices are expected to remain high.
Already there are 20 ships carrying gasoline from commercial foreign stocks to the United States, he said. The supplies from government stocks would be in addition.
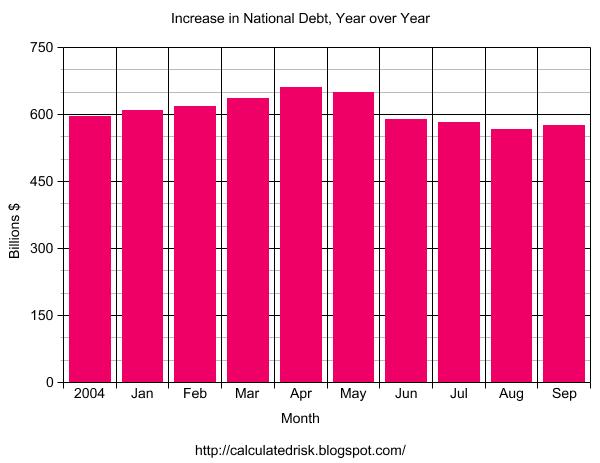
National Debt Increase: $575 Billion YoY
by Calculated Risk on 9/02/2005 03:06:00 PM
As of Sep 1, 2005 our National Debt is:
$7,929,658,283,890.28 (almost $8 Trillion)
As of Aug 1, 2004, our National Debt was:
$7,354,611,427,274.47
SOURCE: US Treasury.
Click on graph for larger image.
For comparison Year over Year Increase:
For Fiscal 2004 (End Sept 30, 2004): $596 Billion
For Jan 1, 2004 to Jan 1, 2005: $609.8 Billion
For Feb 1, 2004 to Feb 1, 2005: $618.6 Billion
For Mar 1, 2004 to Mar 1, 2005: $635.9 Billion
For Apr 1, 2004 to Apr 1, 2005: $660.9 Billion
For May 1, 2004 to May 1, 2005: $648.8 Billion
For Jun 1, 2004 to Jun 1, 2005: $588.0 Billion
For Jul 1, 2004 to Jul 1, 2005: $581.2 Billion
For Aug 1, 2004 to Aug 1, 2005: $566.2 Billion
For Sep 1, 2004 to Sep 1, 2005: $575.0 Billion
The debt situtation worsened slightly in August and fiscal 2005 has a chance to see the worst annual increase in National Debt ever. The current record annual increase in the National Debt is $596 Billion for fiscal '04.
So far, despite the much ballyhooed "budget improvement", the US keeps accumulating debt at about the same pace as last year.
August Jobs Report: 169 Thousand Added
by Calculated Risk on 9/02/2005 09:54:00 AM
From the AP:
In Friday's report, U.S. employers added 169,000 jobs in August, reflecting increased employment in industries, including construction, professional and business services, health care and education, and financial activities. But manufacturers shed jobs for the third straight month, reflecting the industry's sometimes bumpy road to recovery from the 2001 recession.Numbers are before the impact of Hurricane Katrina.
Also encouraging was that payroll gains were revised up for both June and July. Employers in July added 242,000 jobs, an improvement from the government's initial estimate of 207,000 net job gains. For June, 175,000 jobs were added, up from a previous estimate of a 166,000 jobs gain.
The payroll gain of 169,000 reported for August was less than the 190,000 new jobs some economists were forecasting before the release of the report. Economists were predicting the unemployment would hold steady at July's 5 percent rate.
Professional and business services added 29,000 jobs in August. Financial companies added 15,000. Education and health services expanded employment by 43,000. Leisure and hospitality added 34,000 jobs. Retailers added close to 12,000 during the month. Construction companies boosted payrolls by 25,000.
But factories cut another 14,000 jobs in August. Auto makers accounted for the biggest chunk of those job losses.
The labor market is the one part of the economy that has had difficulty getting back to full throttle after the 2001 recession.
Jobseekers still face challenges. The report showed that the average time that the 7.4 million unemployed spent searching for work in August was 18.9 weeks, up from 17.6 weeks in July.
Those who do have jobs are seeing wages rising. Average weekly earnings climbed to $544.59 in August, up from $543.92 in July. The figures aren't adjusted for inflation.
Bush's first term, with a net loss of 759K private sector jobs (a gain of 119K total jobs), has to be considered disappointing. For Bush's 2nd term, anything less than 6.8 Million net jobs will have to be considered poor. And anything above 10 million net jobs as excellent. Of course, in additional to the number of jobs, the quality of the jobs and real wage increases are also important measures.
For the quantity of jobs, the following graph provides a measurement tool for job growth during Bush's 2nd term.

Click on graph for larger image.
The blue line is for 10 million jobs created during Bush's 2nd term; the purple line for 6.8 million jobs. The insert shows net job creation for the first 7 months of the 2nd term - currently just below the blue line.
Thursday, September 01, 2005
DOE: Storm may shut refineries for months
by Calculated Risk on 9/01/2005 02:41:00 PM
From Reuters: Storm may shut refineries for months
The government warned on Thursday that some U.S. refineries shut by Hurricane Katrina may not resume processing oil for several months ...This is a temporary refined products supply shock. See Dr. Thoma's overview of AD vs. AS shocks.
...
"Some refineries likely (will be) able to restart their operations within the next 1 to 2 weeks, while others will likely be down for a more extended period, possibly several months," the Energy Information Administration said.
The Energy Department's analytical arm said nine major oil refineries in Louisiana and Mississippi remained shut from the hurricane. Those refineries account for about 11 percent of total U.S. refining capacity.
"Unlike 2004's Hurricane Ivan, which affected oil production facilities and had a lasting impact on crude oil production in the Gulf of Mexico, it appears that Hurricane Katrina may have a more lasting impact on refinery production and the distribution system," the EIA said in its most recent update on the effects of the hurricane on the energy sector.
Some key points: Oil is a global market. The loss of production in the GOM will be felt worldwide. Gasoline is much more of a domestic market (and regional), though some refined gasoline is imported - so there is a global aspect.
A Supply Shock will force the reduction in consumption of refined products through higher prices (Rationing hasn't been mentioned yet). It is possible that this reduction in demand will lead to lower crude oil prices even though gasoline and other refined products will remain elevated.
Just musing about possibilities ...


