 RSS Feed
 by Calculated Risk on 7/14/2005 08:50:00 PM
Thursday, July 14, 2005
Housing Humor
"The joke now in Lee County [Florida] is when the cops pull you over they ask for your real estate license because not everyone has a driver's license."From this otherwise serious article: Housing boom fraught with disasters waiting to happen.
And a Las Vegas story: Valley Home Buying Fallout.
Dyan Harmell, a Pulte home buyer, is drowning in a sea of debt. Her living room table is covered with bills and she's not quite sure how to pay them.Hat tip to Ben Jones for Vegas story. As the Vegas article says: "The real estate boom that sent Las Vegas home prices skyrocketing may be over, but the hangover is only getting worse."
"There are bills everywhere. House payments and debt," Harmell told FOX5. She's a long way from those heady days of Las Vegas' real estate boom, when she says Pulte's sales staff pushed and pushed her to buy.
"They call you and say 'you are so lucky .. this just came across.. it's going to be worth 100k before it closes,'"said Dyan Harmell. "We came with the hopes of buying two houses. We left the first day owning four. Within the next week, owning 6 -- all the way up to 19."
But Harmell's story is not unique. Walk around Pulte's Solera neighborhood and it's a ghost town. It seems as if "For Sale" signs are everywhere.
Signs that many people who thought they'd make a killing in Las Vegas' real estate market are now trying to unload homes at deep discounts.
Deficit Improvement?
by Calculated Risk on 7/14/2005 04:37:00 PM
The following graph shows the fiscal year to date increase in the National Debt for each of the last six fiscal years. The "fiscal year" is the accounting period of the federal government. It begins on October 1st and ends on September 30th of the next calendar year. Each fiscal year is identified by the calendar year in which it ends - so fiscal year 2005 ends on September 30, 2005.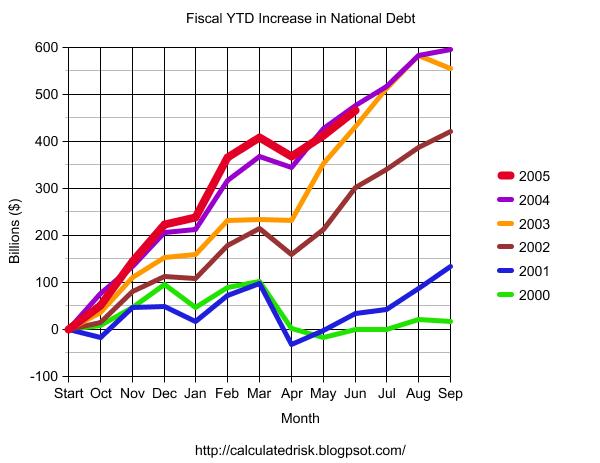
Click on graph for larger image.
The Year to Date increase in the National Debt is plotted for fiscal years 2000 through 2005. For 2005 (in RED) the data is plotted through June, 2005. The graph shows that contrary to the claims of the Bush Administration there has only been minor improvement in the overall deficit picture for 2005.
NOTE: There are many methods of looking at the annual budget deficit. The Bush Administration uses the "Enron Method" commonly called the "unified budget deficit". For a comparison of the unified budget deficit, the general fund deficit and the increase in the National Debt method see "Another Budget, Another Disaster".
Housing: The Bagholders
by Calculated Risk on 7/14/2005 11:47:00 AM
A couple weeks ago on Angry Bear, I quoted Econobrowser's Dr. Hamilton who asked: If there is a housing bubble,
"[W]hy are banks making loans to people who aren't going to be able to pay them back?"To try to answer Dr. Hamilton's question, I suggested we try to identify who would be left holding the bag and work backwards to motive.
Caroline Baum touches on the same topic in Enough About Loans. What About Lenders?
Forget the borrowers for a minute. Who's making these arguably risky loans? Why are lenders extending credit to seemingly bad credit risks?But this still doesn't identify the bagholders. Fannie Mae? Hedge Funds? Are investors underestimating the risk? Just more questions ...
One answer is that they aren't taking the risk. Rather, the risk is spread out, diluted. Lenders sell the loans, or the loans are securitized, in which case investors assume the risk.
As Federal Reserve Chairman Alan Greenspan reiterates, highly efficient capital markets in the U.S. diversify the risk, transferring it from those who don't want it to those who do.
Still, ``someone is taking on a lot of risk for someone to be able to take on less risk,'' [Michael Carliner, an economist at the National Association of Homebuilders in Washington] says.
Spreading the Risk
Then there's the question of whether risk is being priced correctly.
``There's been a dramatic explosion in lending to people with poorer credit-management history, and not a lot of history how certain loan products will perform,'' says Doug Duncan, chief economist at the Mortgage Bankers Association in Washington. ``We have no experience in 10-year interest-only mortgages.''
The risks apply to all parties in the transaction, Duncan says.
``For the borrower, did he understand how the loan would change?'' he says. For the servicer of the mortgage, ``did he understand how the loan would perform? Would it pre-pay faster, go delinquent? For the investor, did it achieve the yield expectations?''
OK, so the risk is spread out among various parties. Still, banks and thrifts do hold loans, especially ARMs, Duncan says. Won't they get stuck if the value of the house goes down, the borrower defaults and the lender can't recoup what was owed -- multiplied many times over?
Trade Deficit Projection: May Review
by Calculated Risk on 7/14/2005 01:24:00 AM
Two months ago I started to build a simple model to project the trade deficit. I didn't make as much progress as I had hoped, but the first two components (oil and China) have performed reasonably well for two months..
First, I projected the oil trade balance. And then I projected the trade deficit with China.
My model projected a deficit of $15.5 Billion Seasonally Adjusted in energy related petroleum product imports. The actual number was $15.8 Billion (see Exhibit 9). This is an error of just under 2%.
For the trade balance with China, my model projected a deficit of $15.5B NSA (SA is not available). The actual number (see Exhibit 14) was $15.7B or an error of 1.2%.
Here are each of the components and how the model performed:
| ITEM | Projection | Actual | Error |
| US Exports to China (NSA) | $3.4B | $3.3B | 3% |
| US Imports from China (NSA) | $18.9B | $19.05B | <1% |
| US Trade Deficit: China (NSA) | $15.5B | $15.75B | 1.6% |
| Oil: Imports SA | $17.4B | $18.1B | 3.9% |
| Oil: Exports SA | $1.9B | $2.3B | 17% |
| OIL Balance SA | $15.5B | $15.8B | 2% |
Some internal data:
| ITEM | Projection | Actual | Error |
| Oil: Contract Price BBL | $42.88 | $43.08 | <1% |
| Oil: BBLs Crude | 337.9M | 318.6M | 6% |
| Oil: Price Other BBL | $49.31 | $48.99 | <1% |
| Oil: BBLs Other | 85M | 99.7M | 15% |
| Oil: Oil Imports NSA | $18.7B | $18.6B | <1% |
It appears my SA factor for oil imports was somewhat off the mark. I'll have to take another look at that step. There is much more to do!
Wednesday, July 13, 2005
US Trade Deficit: $55.3 Billion for May
by Calculated Risk on 7/13/2005 08:33:00 AM
The U.S. Census Bureau and the U.S. Bureau of Economic Analysis released the monthly trade balance report today for May:
"... total May exports of $106.9 billion and imports of $162.2 billion resulted in a goods and services deficit of $55.3 billion, $1.6 billion less than the $56.9 billion in April, revised.Note: all numbers are seasonally adjusted.
May exports were $0.2 billion more than April exports of $106.7 billion.
May imports were $1.4 billion less than April imports of $163.6 billion."

Click on graph for larger image.
UPDATE: fixed a couple of errors.
May
The average contract price for oil dropped from a record $44.76 per barrel in April to $43.08 in May. The temporary drop in oil prices lowered the impact of oil on the trade deficit for May. However, the June trade deficit will be impacted by record high oil prices again.
I think the deficit will start to expand again starting in June.
Tuesday, July 12, 2005
May Trade Deficit Prediction
by Calculated Risk on 7/12/2005 06:39:00 PM
Once again, I've only modeled Oil and China, although I've added exports for Oil. Hopefully I will add more in the future. Here is a review of last month's predictions.
PROJECTIONS:
I: For petroleum, I project that NSA petroleum trade imports will be $18.7 Billion, down from $18.9 Billion in April. Including petroleum exports and adjusting for seasonal effects, the SA oil balance for May is projected at $15.5 Billion. This compares to $17.2 Billion for April.
II: For China, I project (see bottom) a NSA deficit of $15.5 Billion for May compared to $14.7 Billion in April. SA this is $16.1 Billion vs. $15.5 Billion for April.
III. OVERALL: I haven't developed a method for predicting the deficit for other countries, but based on Oil and China I think the deficit in May might improve slightly from April's deficit of $57 Billion. Oil will be about $1.7 Billion less in May (than April) and China approximately $0.6 Billion more.
My Guess (not enough work to call it a projection / estimate): $56.5 Billion Deficit.
NOTE: I expect June to be significantly worse than May.
CHINA: The following is the estimate for trade with China based on this methodology.
CHINA TRADE BALANCE: Table numbers in Billions $
NOT SEASONALLY ADJUSTED
| MONTH | NSA Balance | NSA Exports | NSA Imports |
| February | -$13.9 | $3.08 | $16.95 |
| March | -$12.9 | $3.3 | $16.21 |
| April | -$14.7 | $3.4 | $18.12 |
| May | -$15.5(est) | $3.4(est) | $18.9(est) |
SEASONALLY ADJUSTED (all estimates)
| MONTH | SA Balance | SA Exports | SA Imports |
| February | -$18.1 | $3.08 | $21.19 |
| March | -$15.1 | $3.3 | $18.42 |
| April | -$15.5 | $3.4 | $18.88 |
| May | -$16.1(est) | $3.4(est) | $19.5(est) |
Bernanke on Housing: Market Forces, not Speculation
by Calculated Risk on 7/12/2005 11:27:00 AM
Ben Bernanke gave his first speech this morning as the new chairman of the White House's Council of Economic Advisers. At the American Enterprise Institute, Bernanke commented on housing:
"While speculative behavior appears to be surfacing in some local markets, strong economic fundamentals are contributing importantly to the housing boom,"I disagree. Speculation, including excessive leverage, appears rampant in many markets.
Those fundamentals, Bernanke said, include low mortgage rates, rising employment and incomes, a growing population and a limited supply of homes or land in some areas.I disagree. Low mortgage rates are not a housing "fundamental", employment in California (one of the hottest real estate markets) is struggling, and population growth / limited supply of land was true 10 years ago too when housing was in a bust.
"For example, states exhibiting higher rates of job growth also tend to have experienced greater appreciation in house prices,"
"The administration will continue to monitor" developments in the housing market, Bernanke said. "However, our best defenses against potential problems in housing markets are vigilant lenders and banking regulators, together with perspective and good sense on the part of borrowers."And on the budget deficit:
"One consequence of the strong income growth we are enjoying is higher-than-expected levels of tax collections so far this year which, if maintained with spending controls, will reduce the government's budget deficit for this year well below its projected level,"This is laughable. There is a small improvement in the deficit this year, due to one time events, but next year will be worse.
As the Chairman of the CEA, it is understandable that Bernanke supports the Bush Administration's positions.
Monday, July 11, 2005
Free Money: Part III
by Calculated Risk on 7/11/2005 07:47:00 PM
About four months ago, I wrote that they were giving away free money in The OC (Orange County, CA). At that time the median home price in OC was $555,000.
According to the OC Register, the median home price in May was $585,000. That is a gain of $30,000 in just two months. See Free Money II.
Today the OC Register reports that the OC median home price is now $601,000.
That is a total of $46,000 in FREE MONEY since local RE Broker Gary Watts' prediction of $70,000 in gains this year. I'm starting to feel a little heat for making fun of Mr. Watts' comments.
Housing: The Tax Myth
by Calculated Risk on 7/11/2005 01:31:00 AM
Also: Please see my most recent post on Angry Bear: Help Wanted: Real Estate Agents
Housing: The Tax Myth
Various people have suggested that the current Real Estate boom is a direct result of the Tax Relief Act of 1997. The Tax Relief Act was sponsored by Rep John Kasich (R-OH) that replaced a similar senate Bill sponsored by Senator Roth (R-DE). Although the Bill was Republican sponsored, it passed the Senate 92 - 8 and the House 389 - 43 and was signed into law by President Clinton. Obviously the Act had widespread bipartisan support.
The '97 Act made a major change in how gains on primary residences are taxed. Under the old law, gains could be rolled over into a new home, as long as the home was of equal or greater value than the old home. Once a homeowner (or their spouse) reached the age of 55, they could take a one time exclusion up to $125,000 of the profit from the sale of their residence to "step down" and buy a smaller home. NOTE: I'm outlining the standard rules and skipping all complications.
Under the new law, homeowners receive a $250K (single) or $500K (married) tax exclusion when they sell their home. They can use this exclusion every two years. The old "rollover" and 55+ year old rules no longer apply. Some people have argued that this exclusion is responsible for the real estate boom.
What would motivate someone to take advantage of the exclusion? Here is the simple case: A married couple buys a home for $400K and some time later the house could be sold for $800K. Should they sell to take advantage of the $500K exclusion?
Assumptions: Property taxes are 1% (added: California Law). Transaction costs are 6%.
Here is the argument some people are making: To take advantage of the exclusion, this couple would sell their home for $800K and buy a similar home for $800K. They would have to take out a loan for $48K more on the new home to cover the transaction costs and their property taxes would increase from $4K per year to $8K per year. For doing this transaction, their basis on the new house would be $800K (as opposed to $400K under the old law). This new basis would save the couple from paying capital gains in the future on $352K ($400K minus $48K) or taxes of $70K (if taxed at 20% capital gains).
What is the better deal: 1) To have a $48K immediate increase in debt plus payments of $4K more per year or 2) to have a future tax liability of $70K? For most situations the answer is #2, so the Tax Relief Act of '97 isn't motivating people to buy and sell similar properties.
Is there an example of where the '97 Act would motivate people to buy and sell? If homeowners are moving down in price (moving to a smaller property or moving to a less expensive state or even renting) then the Act might be contributing to the boom. Is there evidence of homeowners en masse moving to renting? No, the opposite has happened. Is there evidence of homeowners moving to smaller homes or less expensive areas? Not a significant number. Besides this would drive up the prices in less expensive areas and lower the price in expensive areas - is that what is happening? No.
The bottom line is the Tax Relief Act of '97 is not contributing to the bubble as some people suspect.
However, there is one impact that might be happening in more expensive areas. Long time homeowners over 55, with significantly more than $500K in equity, might not move to less expensive housing to avoid paying taxes. This might reduce inventories of expensive homes, but I doubt this is a widespread problem.
Friday, July 08, 2005
Housing: Calpers is Selling
by Calculated Risk on 7/08/2005 02:43:00 AM
Forbes reports that "Public pensions are rushing into real estate the way they rushed into tech in the late 1990s."
When the tech boom went bust A few years ago, New Jersey's public pension fund was among the hardest hit in the country, suffering a loss in its tech-laden portfolio of nearly one-third of its value, or $30 billion. Now the State Investment Council has another great idea: In January it decided to jump into--this can't be a surprise--real estate.The Real Estate rush is on:
All told, the top 50 public funds increased their commitments to real estate last year by $9.8 billion, equal to 11% of their property holdings, according to the newsletter Real Estate Alert. Now they have set a target of loading another $34 billion into land and buildings as quickly as is practical, representing a 37% hike to $128 billion, or 7.2% of their assets.And some old timers are worried:
"We're drowning in liquidity," says Dale Anne Reiss, who heads Ernst & Young's real estate practice. "Banks are lending aggressively, and every flavor of institution thinks real estate is the best alternative out there. Some of us remember an equal degree of enthusiasm in the late 1980s just before the market collapsed."Meanwhile, Calpers is selling:
... California's pension fund Calpers, the nation's largest public fund and often in the investing vanguard [is selling]. As less savvy funds rush in, Calpers has lately sold about $7 billion in expensive real estate and taken profits.Of course, in California the affordability index is near the all time low.
"We think the timing is right" to sell, says Brad W. Pacheco, a Calpers spokesman. "We have a property on the block right now and plan to continue selling."
The percentage of households in California able to afford a median-priced home stood at 16 percent in May, a 3 percentage-point decrease compared with the same period a year ago when the Index was at 19 percent, according to a report released today by the California Association of REALTORS® (C.A.R.). The May Housing Affordability Index (HAI) declined 1 percentage point from April, when it stood at 17 percent.
"The record low was 14 percent set back in May and June of 1989," said Robert Kleinhenz, an economist with the group.


