 RSS Feed
 by Calculated Risk on 7/13/2005 08:33:00 AM
Wednesday, July 13, 2005
US Trade Deficit: $55.3 Billion for May
The U.S. Census Bureau and the U.S. Bureau of Economic Analysis released the monthly trade balance report today for May:
"... total May exports of $106.9 billion and imports of $162.2 billion resulted in a goods and services deficit of $55.3 billion, $1.6 billion less than the $56.9 billion in April, revised.Note: all numbers are seasonally adjusted.
May exports were $0.2 billion more than April exports of $106.7 billion.
May imports were $1.4 billion less than April imports of $163.6 billion."

Click on graph for larger image.
UPDATE: fixed a couple of errors.
May
The average contract price for oil dropped from a record $44.76 per barrel in April to $43.08 in May. The temporary drop in oil prices lowered the impact of oil on the trade deficit for May. However, the June trade deficit will be impacted by record high oil prices again.
I think the deficit will start to expand again starting in June.
Tuesday, July 12, 2005
May Trade Deficit Prediction
by Calculated Risk on 7/12/2005 06:39:00 PM
Once again, I've only modeled Oil and China, although I've added exports for Oil. Hopefully I will add more in the future. Here is a review of last month's predictions.
PROJECTIONS:
I: For petroleum, I project that NSA petroleum trade imports will be $18.7 Billion, down from $18.9 Billion in April. Including petroleum exports and adjusting for seasonal effects, the SA oil balance for May is projected at $15.5 Billion. This compares to $17.2 Billion for April.
II: For China, I project (see bottom) a NSA deficit of $15.5 Billion for May compared to $14.7 Billion in April. SA this is $16.1 Billion vs. $15.5 Billion for April.
III. OVERALL: I haven't developed a method for predicting the deficit for other countries, but based on Oil and China I think the deficit in May might improve slightly from April's deficit of $57 Billion. Oil will be about $1.7 Billion less in May (than April) and China approximately $0.6 Billion more.
My Guess (not enough work to call it a projection / estimate): $56.5 Billion Deficit.
NOTE: I expect June to be significantly worse than May.
CHINA: The following is the estimate for trade with China based on this methodology.
CHINA TRADE BALANCE: Table numbers in Billions $
NOT SEASONALLY ADJUSTED
| MONTH | NSA Balance | NSA Exports | NSA Imports |
| February | -$13.9 | $3.08 | $16.95 |
| March | -$12.9 | $3.3 | $16.21 |
| April | -$14.7 | $3.4 | $18.12 |
| May | -$15.5(est) | $3.4(est) | $18.9(est) |
SEASONALLY ADJUSTED (all estimates)
| MONTH | SA Balance | SA Exports | SA Imports |
| February | -$18.1 | $3.08 | $21.19 |
| March | -$15.1 | $3.3 | $18.42 |
| April | -$15.5 | $3.4 | $18.88 |
| May | -$16.1(est) | $3.4(est) | $19.5(est) |
Bernanke on Housing: Market Forces, not Speculation
by Calculated Risk on 7/12/2005 11:27:00 AM
Ben Bernanke gave his first speech this morning as the new chairman of the White House's Council of Economic Advisers. At the American Enterprise Institute, Bernanke commented on housing:
"While speculative behavior appears to be surfacing in some local markets, strong economic fundamentals are contributing importantly to the housing boom,"I disagree. Speculation, including excessive leverage, appears rampant in many markets.
Those fundamentals, Bernanke said, include low mortgage rates, rising employment and incomes, a growing population and a limited supply of homes or land in some areas.I disagree. Low mortgage rates are not a housing "fundamental", employment in California (one of the hottest real estate markets) is struggling, and population growth / limited supply of land was true 10 years ago too when housing was in a bust.
"For example, states exhibiting higher rates of job growth also tend to have experienced greater appreciation in house prices,"
"The administration will continue to monitor" developments in the housing market, Bernanke said. "However, our best defenses against potential problems in housing markets are vigilant lenders and banking regulators, together with perspective and good sense on the part of borrowers."And on the budget deficit:
"One consequence of the strong income growth we are enjoying is higher-than-expected levels of tax collections so far this year which, if maintained with spending controls, will reduce the government's budget deficit for this year well below its projected level,"This is laughable. There is a small improvement in the deficit this year, due to one time events, but next year will be worse.
As the Chairman of the CEA, it is understandable that Bernanke supports the Bush Administration's positions.
Monday, July 11, 2005
Free Money: Part III
by Calculated Risk on 7/11/2005 07:47:00 PM
About four months ago, I wrote that they were giving away free money in The OC (Orange County, CA). At that time the median home price in OC was $555,000.
According to the OC Register, the median home price in May was $585,000. That is a gain of $30,000 in just two months. See Free Money II.
Today the OC Register reports that the OC median home price is now $601,000.
That is a total of $46,000 in FREE MONEY since local RE Broker Gary Watts' prediction of $70,000 in gains this year. I'm starting to feel a little heat for making fun of Mr. Watts' comments.
Housing: The Tax Myth
by Calculated Risk on 7/11/2005 01:31:00 AM
Also: Please see my most recent post on Angry Bear: Help Wanted: Real Estate Agents
Housing: The Tax Myth
Various people have suggested that the current Real Estate boom is a direct result of the Tax Relief Act of 1997. The Tax Relief Act was sponsored by Rep John Kasich (R-OH) that replaced a similar senate Bill sponsored by Senator Roth (R-DE). Although the Bill was Republican sponsored, it passed the Senate 92 - 8 and the House 389 - 43 and was signed into law by President Clinton. Obviously the Act had widespread bipartisan support.
The '97 Act made a major change in how gains on primary residences are taxed. Under the old law, gains could be rolled over into a new home, as long as the home was of equal or greater value than the old home. Once a homeowner (or their spouse) reached the age of 55, they could take a one time exclusion up to $125,000 of the profit from the sale of their residence to "step down" and buy a smaller home. NOTE: I'm outlining the standard rules and skipping all complications.
Under the new law, homeowners receive a $250K (single) or $500K (married) tax exclusion when they sell their home. They can use this exclusion every two years. The old "rollover" and 55+ year old rules no longer apply. Some people have argued that this exclusion is responsible for the real estate boom.
What would motivate someone to take advantage of the exclusion? Here is the simple case: A married couple buys a home for $400K and some time later the house could be sold for $800K. Should they sell to take advantage of the $500K exclusion?
Assumptions: Property taxes are 1% (added: California Law). Transaction costs are 6%.
Here is the argument some people are making: To take advantage of the exclusion, this couple would sell their home for $800K and buy a similar home for $800K. They would have to take out a loan for $48K more on the new home to cover the transaction costs and their property taxes would increase from $4K per year to $8K per year. For doing this transaction, their basis on the new house would be $800K (as opposed to $400K under the old law). This new basis would save the couple from paying capital gains in the future on $352K ($400K minus $48K) or taxes of $70K (if taxed at 20% capital gains).
What is the better deal: 1) To have a $48K immediate increase in debt plus payments of $4K more per year or 2) to have a future tax liability of $70K? For most situations the answer is #2, so the Tax Relief Act of '97 isn't motivating people to buy and sell similar properties.
Is there an example of where the '97 Act would motivate people to buy and sell? If homeowners are moving down in price (moving to a smaller property or moving to a less expensive state or even renting) then the Act might be contributing to the boom. Is there evidence of homeowners en masse moving to renting? No, the opposite has happened. Is there evidence of homeowners moving to smaller homes or less expensive areas? Not a significant number. Besides this would drive up the prices in less expensive areas and lower the price in expensive areas - is that what is happening? No.
The bottom line is the Tax Relief Act of '97 is not contributing to the bubble as some people suspect.
However, there is one impact that might be happening in more expensive areas. Long time homeowners over 55, with significantly more than $500K in equity, might not move to less expensive housing to avoid paying taxes. This might reduce inventories of expensive homes, but I doubt this is a widespread problem.
Friday, July 08, 2005
Housing: Calpers is Selling
by Calculated Risk on 7/08/2005 02:43:00 AM
Forbes reports that "Public pensions are rushing into real estate the way they rushed into tech in the late 1990s."
When the tech boom went bust A few years ago, New Jersey's public pension fund was among the hardest hit in the country, suffering a loss in its tech-laden portfolio of nearly one-third of its value, or $30 billion. Now the State Investment Council has another great idea: In January it decided to jump into--this can't be a surprise--real estate.The Real Estate rush is on:
All told, the top 50 public funds increased their commitments to real estate last year by $9.8 billion, equal to 11% of their property holdings, according to the newsletter Real Estate Alert. Now they have set a target of loading another $34 billion into land and buildings as quickly as is practical, representing a 37% hike to $128 billion, or 7.2% of their assets.And some old timers are worried:
"We're drowning in liquidity," says Dale Anne Reiss, who heads Ernst & Young's real estate practice. "Banks are lending aggressively, and every flavor of institution thinks real estate is the best alternative out there. Some of us remember an equal degree of enthusiasm in the late 1980s just before the market collapsed."Meanwhile, Calpers is selling:
... California's pension fund Calpers, the nation's largest public fund and often in the investing vanguard [is selling]. As less savvy funds rush in, Calpers has lately sold about $7 billion in expensive real estate and taken profits.Of course, in California the affordability index is near the all time low.
"We think the timing is right" to sell, says Brad W. Pacheco, a Calpers spokesman. "We have a property on the block right now and plan to continue selling."
The percentage of households in California able to afford a median-priced home stood at 16 percent in May, a 3 percentage-point decrease compared with the same period a year ago when the Index was at 19 percent, according to a report released today by the California Association of REALTORS® (C.A.R.). The May Housing Affordability Index (HAI) declined 1 percentage point from April, when it stood at 17 percent.
"The record low was 14 percent set back in May and June of 1989," said Robert Kleinhenz, an economist with the group.
Thursday, July 07, 2005
The Real FED Funds Rate
by Calculated Risk on 7/07/2005 06:04:00 PM
Dr. Hamilton of Econbrowser asks: "How high will the Fed push interest rates?"
First, how high is the Fed Funds Rate now? In nominal terms, the FED Funds Rate is 3.25%. But in real terms it is barely positive.
Click on graph for larger image.
For this graph, I subtracted the averaged trailing 12 months median CPI (SOURCE: Cleveland Fed) from the average of the monthly Fed Funds rate (SOURCE: Federal Reserve).
After the '73-75 recession, the FED Funds Rate chased the inflation rate. This led to ever higher inflation until the Volcker FED put the brakes on in the early '80s. The Real FED Funds Rate has declined since the early '80s, with a low in the early '90s as the FED provided stimulus in reaction to the '90/'91 recession.
A neutral Real FED Funds Rate is probably 2% or higher. If the economy is as healthy as the FED claims "... the expansion remains firm and labor market conditions continue to improve gradually.", then the FED will raise the FED Funds Rate to over 4% unless inflation diminishes.
Like many others, I believe the economy has serious and intractable imbalances: the current account deficit, the structural budget deficits and the housing bubble. These are the result of global shifts and poor public and fiscal policies.
Wednesday, July 06, 2005
Bank of England to Lower Rates?
by Calculated Risk on 7/06/2005 07:39:00 PM
UPDATE: We are all British today ...
The Bank of England's Monetary Policy Committee will conclude a two day meeting tomorrow and will announce monetary policy at 12 noon immediately following the Thursday meeting. The London Times has called for a rate cut.
THE Bank of England should move to bolster the economy today with a cut in interest rates, four out of nine members of The Times Monetary Policy Committee (MPC) said yesterday amid anxiety over faltering growth.The calls for a rate cut come as more evidence of economic weakness has emerged:
As worries were fuelled by figures showing manufacturing stagnating and homeowners further scaling back borrowing against their properties, pressure on the Bank to act was emphasised by the close vote among the independent experts.
Fears that the consumer downturn will be prolonged were heightened by the Bank’s latest figures for mortgage equity withdrawal, when homeowners borrow against increased property values for reasons other than moving home. The amount of cash raised in this way fell to £6.4 billion in the first quarter from a revised £8.3 billion in the previous three months and a peak of £17.7 billion in late 2003.The Confederation of British Industry has also called for a rate cut:
In The Times MPC vote, Martin Weale, NIESR’s director, and Sir Steve Robson, former Treasury Second Permanent Secretary, added their voices to call for an immediate rate cut. They were joined by The Times’s Anatole Kaletsky and Sushil Wadhwani, a former member of the Bank’s MPC, who also voted for a cut in June.
Sir Steve said that last week’s overhauled GDP data “suggested that the economy has been losing momentum for a good deal longer than previously thought”. “There are no new factors in prospect which would give it new momentum,” he said. Inflation remained subdued, he added. Mr Weale echoed this, arguing that growth was likely to have been below its long-term trend for a year.
``As there still seems little risk of inflation, the time for action is now,'' said CBI Director-General Digby Jones in the text of speech to be given in northern England this evening. There are ``troubling signs of decline in the housing market where confidence is everything. Such a loss of confidence is something the U.K. economy cannot afford.''
U.K. growth lagged behind the euro region for the first time in more than four years during the first quarter as the increase in consumer spending slowed and manufacturing contracted, government statistics showed last week. Inflation in May stayed at a seven-year high of 1.9 percent for the third month running.
 Click on graph for larger image.
It is possible that the UK housing slowdown is a leading indicator for the US housing market. The BoE didn't lower rates as far as the FED and they started raising rates sooner. Now, with the UK housing market faltering and high street sales slumping, it looks like the peak of the BoE interest rate cycle will be the lowest in fifty years.
What does this mean for the FED? Probably nothing. As Dr. Altig points out, the futures market is indicating at least two more 25 bps point rate increases from the FED at the next two meetings.
UPDATE: Financial Times: Grim outlook for UK manufacturing sector
David Page at Investec said: “Although manufacturing appeared firmer than markets were expecting in May, wholesale revisions in line with last week’s National Accounts revealed a weaker recent past for manufacturing and firmly pointed to a manufacturing recession.”Scotsman: Manufacturing recession rears its ugly head
"UK manufacturers are finding it difficult to pass on cost increases, particularly given the scale of the increase in oil,'' said George Buckley, an economist at Deutsche Bank. "In addition, weakening consumption makes it difficult to sell their products."
Tuesday, July 05, 2005
$1 Million Trailer: Land not included
by Calculated Risk on 7/05/2005 11:22:00 PM
The USA Today reports Mobile home madness: Prices top $1 million
A two-bedroom, two-bathroom mobile home perched on a lot in Malibu is selling for $1.4 million. This isn't a greedy seller asking a ridiculous amount no one will pay. (Photo gallery: Mobile home boasts of spectacular views)Uh, OK.
Two others sold in the area recently for $1.3 million and $1.1 million. Another, at $1.8 million, is in escrow. Nearby, another lists for $2.7 million.
"Those are the hottest (prices) I've ever heard," says Bruce Savage, spokesman for the Manufactured Housing Institute. He says prices in another hot spot, Key West, Fla., top $500,000. As if the price isn't tough enough to swallow, trailer buyers:
•Don't own the land. As with most mobile homes sold in Malibu, the land is owned by the proprietor of the trailer park, in this case, Point Dume Club.
•Still pay rent. Not owning the land means paying what's called "space rent" that is as high as or higher than many mortgages in other parts of the USA. On the $1.4 million trailer, space rent is $2,700 a month.
•Can't get mortgages. Since the buyers don't own the land, most of the mobile homes are paid for in cash or with a personal property loan that usually amounts to $100,000 or less, says Clay Dickens, mortgage loan agent at Community West Bank.
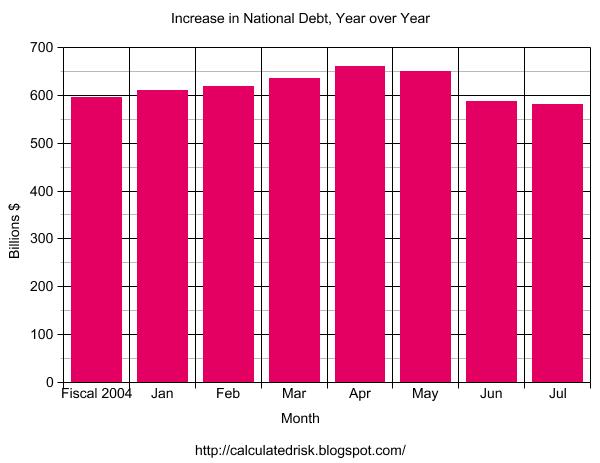
Budget Deficit: $581 Billion Year over Year
by Calculated Risk on 7/05/2005 03:58:00 PM
As of July 1, 2005 our National Debt is:
$7,827,306,264,287.53 (Over $7.8 Trillion)
As of July 1, 2004, our National Debt was:
$7,246,142,474,951.77
SOURCE: US Treasury.
Click on graph for larger image.
For comparison:
For Fiscal 2004 (End Sept 30, 2004): $596 Billion
For Jan 1, 2004 to Jan 1, 2005: $609.8 Billion
For Feb 1, 2004 to Feb 1, 2005: $618.6 Billion
For Mar 1, 2004 to Mar 1, 2005: $635.9 Billion
For Apr 1, 2004 to Apr 1, 2005: $660.9 Billion
For May 1, 2004 to May 1, 2005: $648.8 Billion
For Jun 1, 2004 to Jun 1, 2005: $588.0 Billion
For Jul 1, 2004 to Jul 1, 2005: $581.2 Billion
I still expect fiscal 2005 to set a new nominal budget deficit record although it might be close. The current record annual increase in the National Debt is $596 Billion for fiscal '04.


