 RSS Feed
 by Calculated Risk on 6/06/2005 03:37:00 PM
Monday, June 06, 2005
My New Reading List
From the Westchester County Business Journal: Real estate book for 'dummies' exceeds expectations
UPDATE: Added to photo, thanks to benwood!
Click on covers for larger image.
Last year Wiley Publishing Inc. in Indianapolis tapped Yoegel to write its "Real Estate License Exams for Dummies" book.And another interesting employment statistic:
So far the book, released in January, has been doing well.
"It's probably tripled our expectation. It's a first," said Diane Steele, vice president and publisher, consumer dummies line at Wiley.
In 2003 there were 14,000 real estate sales agents licensed in Connecticut. This year that number is expected to climb to 18,000, according to the state's Department of Consumer Protection, Real Estate Unit.
That is impressive growth, but in California we have 436,735 real estate agents!
Sunday, June 05, 2005
TIME: Home Sweet Home
by Calculated Risk on 6/05/2005 04:49:00 PM
The housing market gets another cover: Click on cover for larger image.
From the story, "Home Sweet Home", first the anecdote:
"I went to look at some homes in Palmdale- Lancaster [an area of Los Angeles County]," [John williams, a disc jockey from long beach, Calif] says, "and the woman showing me and a group of other investors around was a hairdresser who works for Century 21 on the side. We went into Taco Bell for lunch. The girl at the register heard us talking, and she told us she just got her mortgage broker's license."
And from an economist:
To Edward Leamer, economist and director of the ucla Anderson Forecast, the housing market, especially in hot coastal areas, is a bubble just as ripe for popping. "We've had a more than doubling of housing prices in the past three years here in Southern California, for instance, and there's no fundamental driving it," he says. "There isn't some big crush of people coming to California. That's ridiculous."
Instead, say Leamer and other bubbleologists, what's driving the market is low interest rates, herd psychology, speculation and the expectation of unending price increases. (One study found that Los Angeles homeowners expect their home values to grow 22% every year for a decade.) Meanwhile, promiscuous lenders are throwing money at buyers like beads during Mardi Gras. "Anybody who can crawl in off the street can get a loan with 0% down at three or four times their income," Leamer says.
Friday, June 03, 2005
Shiller on NPR
by Calculated Risk on 6/03/2005 09:47:00 PM
Yale University economics professor Robert Shiller appeared on NPR today to discuss - what else? - the real estate bubble. Here are a few quotes:
"But I think the nature of the talk may be subtly changing. I mean people are seem to be much more aware of the possibility that we are in a bubble now. Whether they call it a bubble or something else, lots of people are expressing awareness that something is funny here."On the fundamentals of Real Estate:
"Right now price relative to rent, price relative to construction cost, price relative to income, those are at high or record levels. And, uh, people are starting to become aware of that. And that's the change that will eventually end this bubble."On the myth that housing prices do not decline:
"Although home prices have gone up a lot in the recent years, they are just the same houses, right? There is no change in the services they provide, its just the value we put on them. And so houses' value can just evaporate overnight too. If people suddenly get vary wary of investing houses, because they don't think the prices are going to go up, or if they think they are going to fall that will cause home prices to fall."On the breadth of the bubble:
"Alan Greenspan said we have a lot of local bubbles - that we don't have a national bubble. Well, Ok, maybe he is technically right, but the enthusiasm is infectious and it is starting to spread all over the place."On speculating today:
"I think that one conceivably could buy a house to try to flip it in a year. There is a good chance that prices will be a lot higher in a year, but I wouldn't be too sure. I think it is getting risky."Bubbles last longer than most people expect and end quicker. In June 2006, I expect to be writing about the impact of the housing bust, not when it will bust. But you never know.
Thursday, June 02, 2005
Budget Deficit Improves: Only $588 Billion
by Calculated Risk on 6/02/2005 08:46:00 PM
My congressman Christopher Cox (R-CA) is in the news as Bush's nominee to lead the U.S. Securities and Exchange Commission. So I will quote Mr. Cox on how to look at the budget deficit:
In a 1998 letter, Christorpher Cox wrote:
"... the surplus would disappear if Social Security payroll taxes weren't used to pay for other deficit spending. In 1998, Social Security payroll taxes exceeded Social Security benefit payments by $86 billion. If those extra payroll taxes hadn't been spent on other programs, the federal government would have shown a deficit of $16 billion for 1998."Taking Mr. Cox' lead, here is the current Year over Year deficit number (June 1, 2004 to June 1, 2005). As of June 1, 2005 our National Debt is:
$7,775,553,817,632.01 (Almost $7.8 Trillion)
As of June 1, 2004, our National Debt was:
$7,187,557,826,891.12
The good news is the National Debt has only increased $588.0 Billion over the last 12 months. SOURCE: US Treasury
The bad news is the improvement is due mainly to one time events (mostly the Real Estate bubble). As Dr. Setser has noted:
Tax revenues seem to have outperformed in part because of capital gains on real estate (and also on the equities). In an asset-based economy, it increasingly seems that tax revenues are quite pro-cyclical, rising more than expected in good times and falling a bit more than expected in bad times. The revenues from the amnesty (actually a low tax rate) on the repatriation of profits probably helped too.

Click on graph for larger image.
For comparison:
For Fiscal 2004 (End Sept 30, 2004): $596 Billion
For Jan 1, 2004 to Jan 1, 2005: $609.8 Billion
For Feb 1, 2004 to Feb 1, 2005: $618.6 Billion
For Mar 1, 2004 to Mar 1, 2005: $635.9 Billion
For Apr 1, 2004 to Apr 1, 2005: $660.9 Billion
For May 1, 2004 to May 1, 2005: $648.8 Billion
For Jun 1, 2004 to Jun 1, 2005: $588.0 Billion
A decent improvement.
Free Money: Part II
by Calculated Risk on 6/02/2005 07:08:00 PM
A couple of months ago, I wrote that they were giving away free money in The OC (Orange County, CA). At that time the median home price in OC was $555,000.
According to the OC Register, the mediam home price is now $585,000. That is a gain of $30,000 in just two months.
Prices are well on their way to local RE Broker Gary Watts' prediction of $70,000 in gains this year. Amazing.
Wednesday, June 01, 2005
No Housing Bubble?
by Calculated Risk on 6/01/2005 11:36:00 PM
Last week, Barry Ritholtz of The Big Picture wrote: "Don't Buy Housing Bubble Propaganda". I recommend it.
Today, Dr. Richard Rosen (Senior Economist Chicago Federal Reserve Bank) release a Fed Letter: "Explaining recent changes in home prices". Also worth reading.
Speculation, excessive leverage, loose lending practices are all evidence of a bubble.
Price Rent Ratio Update
by Calculated Risk on 6/01/2005 05:03:00 PM
OFHEO released their Q1 2005 report showing a 12.5% annual housing price increase nationwide over the past year. Kash on Angry Bear breaks down the data by key metropolitan areas and provides a graph of inflation adjusted house prices: New House Price Data.
Another way to look at the data is to compare house prices vs. equivalent owner's rent for different areas of the Country. This measure of fundamental housing value, called the price-rent ratio, was suggested by the Federal Reserve's Krainer and Wei in "House Prices and Fundamental Value". The following graph shows the U.S. and Los Angeles price-rent ratios since 1982. The price component is from the OFHEO home price index and the rent series is from the BLS owner's equivalent rent index. 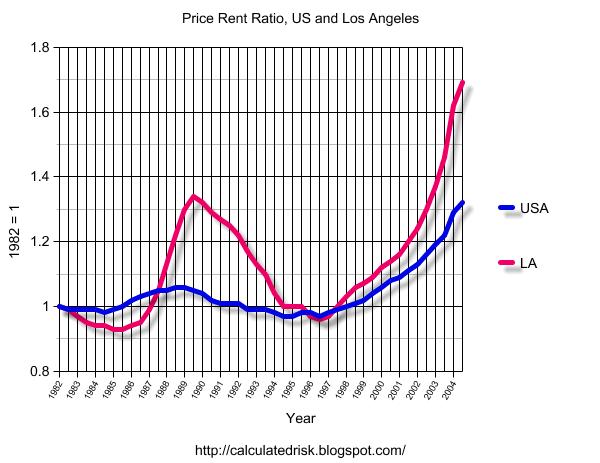
Click on graphs for larger image.
The LA housing bubble of the late '80s is very clear. After the bubble burst, it took several years for the Price-Rent Ratio to return to normal. For a graph of the LA bust see "After the Boom".
Krainer and Wei "found that most of the variance in the price-rent ratio is due to changes in future returns and not to changes in rents. This is relevant because it suggests the likely future path of the ratio. If the ratio is to return to its average level, it will probably do so through slower house price appreciation."
The owner's rent equivalent data series from the BLS starts in '97 for many areas. Using (1997 = 1) the following graph compares the Price-Rent ratio for Los Angeles, Washington D.C., Miami and Wichita / Peoria.
It should come as no surprise that LA, DC and Miami house prices are all significantly above the Owner's equivalent rent.
But is there a bubble in Peoria? The data suggests that housing in Peoria, Wichita, and Indianapolis are all about 15% overvalued. However I don't expect nominal price decreases in those areas. More likely is slow appreciation (below the inflation rate) for a few years until rents catch up with house prices.
The Price-Rent ratio suggests that housing is overvalued in most of the United States and significantly overvalued in the larger metropolitan areas.
OFHEO: House Prices Continue to Rise Rapidly
by Calculated Risk on 6/01/2005 11:13:00 AM
OFHEO released their Q1 2005 report: "House Price Index Shows a 12.5 Percent Increase Over the Past Year"
WASHINGTON, D.C. – Average U.S. home prices increased 12.50 percent from the first quarter of 2004 through the first quarter of 2005. Appreciation for the most recent quarter was 2.21 percent, or an annualized rate of 8.82 percent. The new data represent the largest four quarter increase since the third quarter of 2004, when appreciation surpassed any increase in over 25 years. The figures were released today by OFHEO Acting Director Stephen A. Blumenthal, as part of the House Price Index (HPI), a quarterly report analyzing housing price appreciation trends.
“The House Price Index shows the rise in house prices continues at an extremely strong pace and raises the potential for declines in some areas later on,” said OFHEO Chief Economist Patrick Lawler.
More to come ...
Tuesday, May 31, 2005
UK: Retail Sales Continue Slide
by Calculated Risk on 5/31/2005 09:00:00 PM
UK's retailers suffered their third consecutive month of declining sales, according to the Independent.
'...the CBI said retailers suffered their third successive monthly fall in sales - making it the worst quarter since the early recession of the early Nineties.More from the Independent:
There was a further blow for retailers from a survey showing the Bank Holiday weekend provided a lacklustre kick-start to half-term holiday trading. John Butler, the UK economist at HSBC, said: "Households no longer intend to make a major purchase. The big-ticket durable boom is over along with the boom in mortgage equity withdrawal."'
'The CBI survey, which covered 226 companies representing four out of 10 shops across the UK, said the number reporting a fall in sales compared with a year ago outweighed those seeing a rise by 7 per cent. This was an improvement from the balance of minus 14 per cent in April but left the rolling three-monthly average at its lowest level sinc e August 1992.
FootFall said the number of visitors to Britain's major shopping centres over the three-day weekend was 1.3 per cent lower than a year ago, driven by a 7 per cent slump in footfall on Monday.'
For more on the UK retail slump:
Times: Retailers expect slowdown to stay for summer
Financial Express: ‘UK retail sales fell again in May’
"Broadly speaking, the categories of goods most closely correlated with housing transactions have fared worse than the average over the past year," said John Longworth, executive director of ASDA and chairman of the CBI's survey panel.Retail Week: Retail sales fall for the third month
Asda executive director and chairman of the CBI's DTS panel John Longworth said: “Sales volumes improved between April and May, but volumes remain a little lower than a year ago and prices are on a downward trend.”It is possible that the UK is leading the US into an economic slowdown. On Angry Bear I presented a chart showing that the US Fed rate increases are about 6 to 8 months behind the BoE. In the UK it started with a housing slowdown and has now moved to retail.
"Sales of groceries, books and stationery are up on a year ago, but those of big ticket items, furniture, carpets, DIY goods and clothing are down,” he added.
Monday, May 30, 2005
Housing and M3
by Calculated Risk on 5/30/2005 01:47:00 AM
My weekly post is up on Angry Bear: Housing, the Fed and M3
Earlier I linked to Federal Reserve Vice Chairman Ferguson's remarks on housing.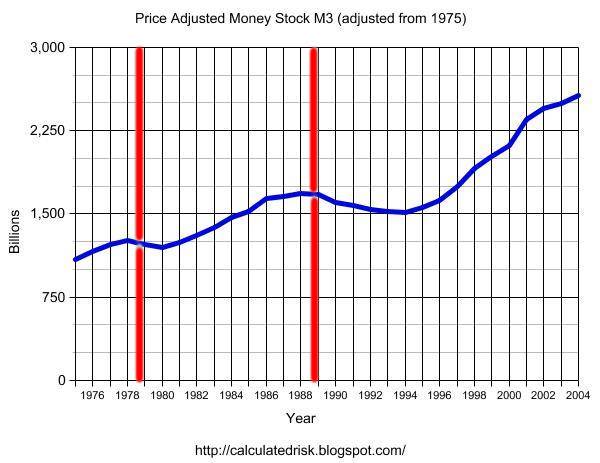
Click on graph for larger image.
Expanding on Dr. Ferguson's analysis, this graph shows price adjusted M3 since 1975. The vertical lines indicate when housing peaked in the previous cycles.
It is important to repeat Dr. Ferguson’s caution regarding not confusing correlation with causation, but it does appear that housing has peaked in the past when price adjusted M3 has peaked.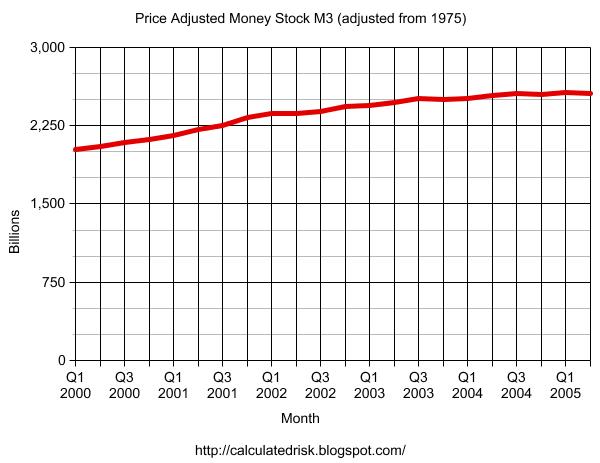
And the second graph shows price adjusted M3 since Q1 2000. It appears that M3 is peaking right now.
We will have to wait to see if housing is peaking. But one thing is certain, the number of articles on housing is setting new highs!
See my previous posts and Patrick's links for a list of recent articles.


