 RSS Feed
 by Calculated Risk on 5/30/2005 01:47:00 AM
Monday, May 30, 2005
Housing and M3
My weekly post is up on Angry Bear: Housing, the Fed and M3
Earlier I linked to Federal Reserve Vice Chairman Ferguson's remarks on housing.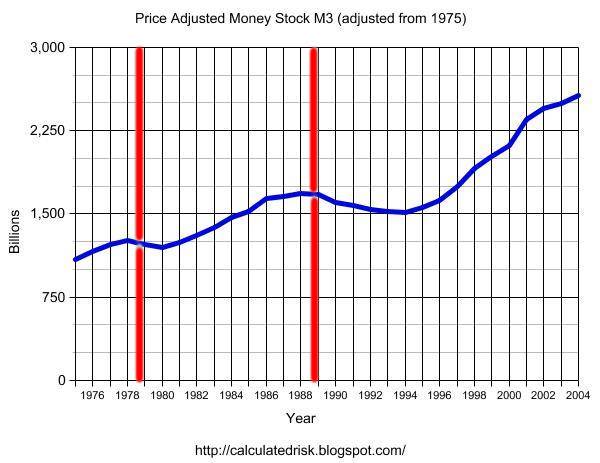
Click on graph for larger image.
Expanding on Dr. Ferguson's analysis, this graph shows price adjusted M3 since 1975. The vertical lines indicate when housing peaked in the previous cycles.
It is important to repeat Dr. Ferguson’s caution regarding not confusing correlation with causation, but it does appear that housing has peaked in the past when price adjusted M3 has peaked.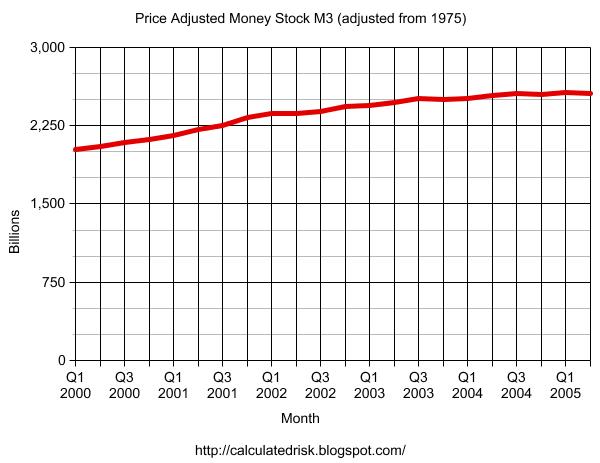
And the second graph shows price adjusted M3 since Q1 2000. It appears that M3 is peaking right now.
We will have to wait to see if housing is peaking. But one thing is certain, the number of articles on housing is setting new highs!
See my previous posts and Patrick's links for a list of recent articles.


