by Calculated Risk on 10/17/2018 08:12:00 PM
Wednesday, October 17, 2018
Thursday: Unemployment Claims, Philly Fed Mfg
Thursday:
• At 8:30 AM ET, The initial weekly unemployment claims report will be released. The consensus is for 215 thousand initial claims, up from 214 thousand the previous week.
• At 8:30 AM, the Philly Fed manufacturing survey for October. The consensus is for a reading of 20.3, down from 22.9.
Lawler: Early Read on Existing Home Sales in September
by Calculated Risk on 10/17/2018 03:57:00 PM
From housing economist Tom Lawler:
Based on publicly-available local realtor/MLS reports from across the country released through today, I project that existing home sales as estimated by the National Association of Realtors ran at a seasonally adjusted annual rate of 5.20 million in September, down 2.6% from August’s preliminary pace and down 3.2% from last September’s seasonally adjusted pace. Unadjusted sales should show a larger YOY % decline, reflecting this September’s lower business-day count compared to last September.
On the inventory front, local realtor/MLS data, as well as data from other inventory trackers, suggest that the inventory of existing homes for sale in September showed a small (and contra-seasonal) increase over August, and I project that the NAR’s estimate of the inventory of existing homes for sale at the end of September will be 1.94 million, up 1.0% from August’s preliminary estimate and up [4.3% from September 2017].
Finally, local realtor/MLS data suggest that the median US existing single-family home sales price last month was up about 4.3% from last September.
CR Note: The NAR is scheduled to released September existing home sales on Friday. The consensus is also for sales of 5.30 million SAAR, down from 5.34 million in August. Take the under.
FOMC Minutes: Further Gradual Increases "Would be appropriate"
by Calculated Risk on 10/17/2018 03:01:00 PM
From the Fed: Minutes of the Federal Open Market Committee, September 25-26, 2018:
In their consideration of monetary policy at this meeting, participants generally judged that the economy was evolving about as anticipated, with real economic activity rising at a strong rate, labor market conditions continuing to strengthen, and inflation near the Committee's objective. Based on their current assessments, all participants expressed the view that it would be appropriate for the Committee to continue its gradual approach to policy firming by raising the target range for the federal funds rate 25 basis points at this meeting. Almost all considered that it was also appropriate to revise the Committee's postmeeting statement in order to remove the language stating that "the stance of monetary policy remains accommodative." Participants discussed a number of reasons for removing the language at this time, noting that the Committee would not be signaling a change in the expected path for policy, particularly as the target range for the federal funds rate announced after the Committee's meeting would still be below all of the estimates of its longer-run level submitted in the September SEP. In addition, waiting until the target range for the federal funds rate had been increased further to remove the characterization of the policy stance as "accommodative" could convey a false sense of precision in light of the considerable uncertainty surrounding all estimates of the neutral federal funds rate.
With regard to the outlook for monetary policy beyond this meeting, participants generally anticipated that further gradual increases in the target range for the federal funds rate would most likely be consistent with a sustained economic expansion, strong labor market conditions, and inflation near 2 percent over the medium term. This gradual approach would balance the risk of tightening monetary policy too quickly, which could lead to an abrupt slowing in the economy and inflation moving below the Committee's objective, against the risk of moving too slowly, which could engender inflation persistently above the objective and possibly contribute to a buildup of financial imbalances.
Participants offered their views about how much additional policy firming would likely be required for the Committee to sustainably achieve its objectives of maximum employment and 2 percent inflation. A few participants expected that policy would need to become modestly restrictive for a time and a number judged that it would be necessary to temporarily raise the federal funds rate above their assessments of its longer-run level in order to reduce the risk of a sustained overshooting of the Committee's 2 percent inflation objective or the risk posed by significant financial imbalances. A couple of participants indicated that they would not favor adopting a restrictive policy stance in the absence of clear signs of an overheating economy and rising inflation.
emphasis added
Comments on September Housing Starts
by Calculated Risk on 10/17/2018 10:43:00 AM
Earlier: Housing Starts Decreased to 1.201 Million Annual Rate in September
Housing starts in September were slightly below expectations, and starts for July and August were revised down slightly. Overall this was close to expectations.
The housing starts report released this morning showed starts were down 5.8% in September compared to August (August starts were revised down), and starts were up 3.7% year-over-year compared to September 2017.
Single family starts were up 4.8% year-over-year.
This first graph shows the month to month comparison for total starts between 2017 (blue) and 2018 (red).

Starts were up 3.7% in September compared to September 2017.
Through eight months, starts are up 6.4% year-to-date compared to the same period in 2017. That is a decent increase.
Note that 2017 finished strong, so the year-over-year comparisons will be more difficult in Q4.
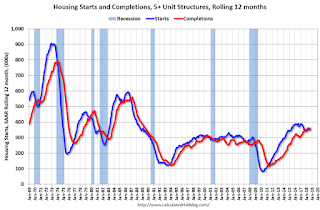
Below is an update to the graph comparing multi-family starts and completions. Since it usually takes over a year on average to complete a multi-family project, there is a lag between multi-family starts and completions. Completions are important because that is new supply added to the market, and starts are important because that is future new supply (units under construction is also important for employment).
These graphs use a 12 month rolling total for NSA starts and completions.

The rolling 12 month total for starts (blue line) increased steadily for several years following the great recession - but turned down, and has moved sideways recently. Completions (red line) had lagged behind - however completions and starts are at about the same level now (more deliveries).
It is likely that both starts and completions, on rolling 12 months basis, will now move mostly sideways.
As I've been noting for a few years, the significant growth in multi-family starts is behind us - multi-family starts peaked in June 2015 (at 510 thousand SAAR).

Note the relatively low level of single family starts and completions. The "wide bottom" was what I was forecasting following the recession, and now I expect further of increases in single family starts and completions.
Note: Three months ago, in response to numerous articles discussing the "slowing housing market" and some suggesting "housing has peaked", I wrote: Has Housing Market Activity Peaked? and Has the Housing Market Peaked? (Part 2). My view - that there will be further growth in housing starts - remains the same.
Housing Starts Decreased to 1.201 Million Annual Rate in September
by Calculated Risk on 10/17/2018 08:43:00 AM
From the Census Bureau: Permits, Starts and Completions
Housing Starts:
Privately‐owned housing starts in September were at a seasonally adjusted annual rate of 1,201,000. This is 5.3 percent below the revised August estimate of 1,268,000, but is 3.7 percent above the September 2017 rate of 1,158,000. Single‐family housing starts in September were at a rate of 871,000; this is 0.9 percent below the revised August figure of 879,000. The September rate for units in buildings with five units or more was 324,000.
Building Permits:
Privately‐owned housing units authorized by building permits in September were at a seasonally adjusted annual rate of 1,241,000. This is 0.6 percent below the revised August rate of 1,249,000 and is 1.0 percent below the September 2017 rate of 1,254,000. Single‐family authorizations in September were at a rate of 851,000; this is 2.9 percent above the revised August figure of 827,000. Authorizations of units in buildings with five units or more were at a rate of 351,000 in September.
emphasis added
 Click on graph for larger image.
The first graph shows single and multi-family housing starts for the last several years.
Multi-family starts (red, 2+ units) decreased in September compared to August. Multi-family starts were up slightly year-over-year in September.
Multi-family is volatile month-to-month, and has been mostly moving sideways the last few years.
Single-family starts (blue) decreased slightly in September, but were up 4.8% year-over-year.
 The second graph shows total and single unit starts since 1968.
 The second graph shows the huge collapse following the housing bubble, and then - after moving sideways for a couple of years - housing is now recovering (but still historically fairly low).
Total housing starts in September were slightly below expectations, and starts for July and August were revised down slightly, combined.
I'll have more later ...
MBA: Mortgage Applications Decreased in Latest Weekly Survey
by Calculated Risk on 10/17/2018 07:00:00 AM
From the MBA: Mortgage Applications Decline in Latest MBA Weekly Survey
Mortgage applications decreased 7.1 percent from one week earlier, according to data from the Mortgage Bankers Association’s (MBA) Weekly Mortgage Applications Survey for the week ending October 12, 2018. This week’s results didn’t include adjustment for the Columbus Day holiday.
... The Refinance Index decreased 9 percent from the previous week. The seasonally adjusted Purchase Index decreased 6 percent from one week earlier. The unadjusted Purchase Index decreased 6 percent compared with the previous week and was 2 percent higher than the same week one year ago. ...
The average contract interest rate for 30-year fixed-rate mortgages with conforming loan balances ($453,100 or less) increased to its highest level since February 2011, 5.10 percent, from 5.05 percent, with points increasing to 0.55 from 0.51 (including the origination fee) for 80 percent loan-to-value ratio (LTV) loans.
emphasis added
 Click on graph for larger image.
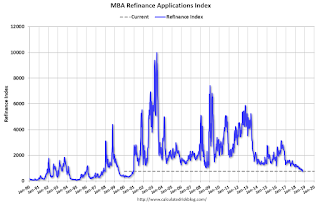
The first graph shows the refinance index since 1990.
Refinance activity will not pick up significantly unless mortgage rates fall 50 bps or more from the recent level.
 The second graph shows the MBA mortgage purchase index
 According to the MBA, purchase activity is up 2% year-over-year.
Tuesday, October 16, 2018
Wednesday: Housing Starts, FOMC Minutes
by Calculated Risk on 10/16/2018 07:57:00 PM
Wednesday:
• At 7:00 AM ET, The Mortgage Bankers Association (MBA) will release the results for the mortgage purchase applications index.
• At 8:30 AM, Housing Starts for September. The consensus is for 1.216 million SAAR, down from 1.282 million SAAR.
• At 2:00 PM, The Fed will release the FOMC Minutes for the Meeting of September 25-26, 2018
Update: Real Estate Agent Boom and Bust
by Calculated Risk on 10/16/2018 03:01:00 PM
Way back in 2005, I posted a graph of the Real Estate Agent Boom. Here is another update to the graph.
The graph shows the number of real estate licensees in California.
The number of agents peaked at the end of 2007 (housing activity peaked in 2005, and prices in 2006).
The number of salesperson's licenses is off 28% from the peak, and is increasing again (up 8.6% from low). The number of salesperson's licenses has increased to September 2004 levels.
Brokers' licenses are off 14.1% from the peak and have fallen to December 2005 levels, and are still slowly declining (down 1% year-over-year).

We are seeing a pickup in Real Estate licensees in California, although the number of Brokers is still declining.
BLS: Job Openings "reached a series high of 7.1 million" in August
by Calculated Risk on 10/16/2018 10:17:00 AM
Notes: In August there were 6.939 million job openings, and, according to the August Employment report, there were 6.234 million unemployed. So, for the fifth consecutive month, there were more job openings than people unemployed. Also note that the number of job openings has exceeded the number of hires since January 2015.
From the BLS: Job Openings and Labor Turnover Summary
The number of job openings reached a series high of 7.1 million on the last business day of August, the U.S. Bureau of Labor Statistics reported today. Over the month, hires and separations were little changed at 5.8 million and 5.7 million, respectively. Within separations, the quits rate was unchanged at 2.4 percent and the layoffs and discharges rate was little changed at 1.2 percent. ...The following graph shows job openings (yellow line), hires (dark blue), Layoff, Discharges and other (red column), and Quits (light blue column) from the JOLTS.
The number of quits was little changed in August at 3.6 million. The quits rate was 2.4 percent. The number of quits was little changed for total private and for government. Quits increased in wholesale trade (+24,000) but decreased in professional and business services (-82,000). The number of quits was little changed in all four regions.
emphasis added
This series started in December 2000.
Note: The difference between JOLTS hires and separations is similar to the CES (payroll survey) net jobs headline numbers. This report is for August, the most recent employment report was for September.
 Click on graph for larger image.
Note that hires (dark blue) and total separations (red and light blue columns stacked) are pretty close each month. This is a measure of labor market turnover. When the blue line is above the two stacked columns, the economy is adding net jobs - when it is below the columns, the economy is losing jobs.
Jobs openings increased in August to 7.136 million from 7.077 million in July.
The number of job openings (yellow) are up 18% year-over-year.
Quits are up 13% year-over-year. These are voluntary separations. (see light blue columns at bottom of graph for trend for "quits").
Job openings are at a series high (started in 2001), and quits are increasing year-over-year. This was a strong report.
NAHB: Builder Confidence increased to 68 in October
by Calculated Risk on 10/16/2018 10:06:00 AM
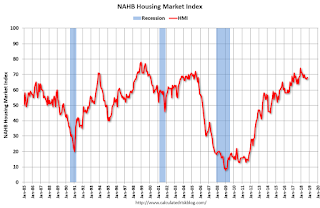
The National Association of Home Builders (NAHB) reported the housing market index (HMI) was at 68 in October, up from 67 in September. Any number above 50 indicates that more builders view sales conditions as good than poor.
From NAHB: Builder Confidence Rises One Point in October, Remains at Summer Levels
Builder confidence in the market for newly-built single-family homes rose one point to 68 in October on the NAHB/Wells Fargo Housing Market Index (HMI). Builder confidence levels have held in the high 60s since June.
“Builders are motivated by solid housing demand, fueled by a growing economy and a generational low for unemployment,” said NAHB Chairman Randy Noel. “Builders are also relieved that lumber prices have declined for three straight months from elevated levels earlier this summer, but they need to manage supply-side costs to keep home prices affordable.”
“Favorable economic conditions and demographic tailwinds should continue to support demand, but housing affordability has become a challenge due to ongoing price and interest rate increases,” said NAHB Chief Economist Robert Dietz. “Unless housing affordability stabilizes, the market risks losing additional momentum as we head into 2019.”
...
The HMI index measuring current sales conditions rose one point to 74 and the component gauging expectations in the next six months increased a single point to 75. Meanwhile, the metric charting buyer traffic registered a four-point uptick to 53.
Looking at the three-month moving averages for regional HMI scores, the Northeast rose three points to 57 and the South edged up one point to 71. The West held steady at 74 and the Midwest fell two points to 57.
emphasis added
 Click on graph for larger image.
This graph show the NAHB index since Jan 1985.
This was slightly above the consensus forecast, and a solid reading.


