by Calculated Risk on 10/31/2008 11:49:00 AM
Friday, October 31, 2008
Residential Investment and Home Improvement
We frequently discuss "residential investment" (RI) without mentioning the components of RI according to the Bureau of Economic Analysis (BEA). Residential investment includes new single family structures, multifamily structures, home improvement, broker's commissions, and a few minor categories. Click on graph for larger image in new window.
This graph shows the various components of RI as a percent of GDP for the last 50 years. The most important components are investment in single family structures followed by home improvement.
Investment in home improvement ($175.2 billion SAAR) is almost at the same level as investment in single family structures ($176.0 billion SAAR) in Q3 2008.
Let's take a closer look at these two key components of RI: As everyone knows, investment in single family structures has fallen off a cliff. This is the component of RI that gets all the media attention - although usually from stories about single family starts and new home sales (related to RI in single family structures).
Currently investment in single family structures is at 1.22% of GDP, significantly below the average of the last 50 years of 2.35% - and just above the record low in 1982 of 1.20%.
But what about home improvement?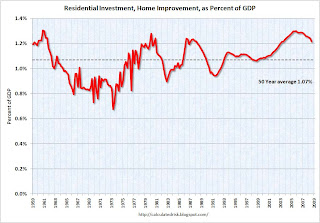 The third graph shows home improvement investment as a percent of GDP.
Home improvement is at 1.21% of GDP, off the high of 1.3% in Q4 2005 - but still well above the average of the last 50 years of 1.07%. Maybe lenders are boosting home improvement spending fixing up all those damaged REOs!
This would seem to suggest there is significant downside risk to home improvement spending over the next couple of years.
Thursday, October 30, 2008
Investment in Structures: Residential vs. Non-Residential
by Calculated Risk on 10/30/2008 09:09:00 AM
The following graph shows residential investment compared to investment in non-residential structures as a percent of GDP since 1960. All data from the BEA.
Note: Residential investment is primarily single family structures, multi-family structures, commissions, and home improvement. Click on graph for larger image in new window.
The recent housing boom and bust is very clear (in red).
Residential investment was 3.3% of GDP in Q3 2008, the lowest level since 1982 (just under 3.2%).
Non-residential investment in structures increased to almost 4% of GDP in Q3. This investment is slowing down right now (the Census Bureau has reported declines in non-residential investment for the last two months), and investment in non-residential structures will almost certainly be negative in Q4.
The positive contributions to GDP were exports, government spending, and investment in non-residential structures. Non-residential structures will be negative in Q4, and exports are slowing - so Q4 GDP will probably be much worse than Q3.
Note: I'll have much more on non-residential investment in offices, malls and hotels when the underlying details are released in a few days.
Wednesday, October 01, 2008
Non-Residential Construction Spending Declines
by Calculated Risk on 10/01/2008 10:00:00 AM
It now appears that private non-residential construction has peaked, and I expect non-residential investment will decline sharply over the next year.
From the Census Bureau: August 2008 Construction at 1,072.1 Billion Annual Rate
Spending on private construction was at a seasonally adjusted annual rate of $759.6 billion, 0.3 percent below the revised July estimate of $761.8 billion.
Residential construction was at a seasonally adjusted annual rate of $343.6 billion in August, 0.3 percent above the revised July estimate of $342.5 billion.
Nonresidential construction was at a seasonally adjusted annual rate of $416.0 billion in August, 0.8 percent below the revised July estimate of $419.3 billion.
 Click on graph for larger image in new window.
The graph shows private residential and nonresidential construction spending since 1993.
Nonresidential spending has been strong as builders complete projects, but there is substantial evidence of a looming slowdown - less lending for new projects, less work for architects - and it appears the expected slowdown in non-residential spending has arrived.

The second graph shows the year-over-year change for private residential and non-residential construction spending.
The YoY change in non-residential spending is starting to slow down and will probably turn negative later this year or early in 2009.
Not only has Personal Consumption Expenditures (PCE) turned negative in Q3, but it now looks like non-residential investment in structures is starting to decline. This was one of few bright spots in the economy (along with exports), and a decline in non-residential investment is more evidence of a recession.
Wednesday, September 10, 2008
Investment: Residential vs. Non-Residential
by Calculated Risk on 9/10/2008 09:55:00 PM
Since investment in non-residential structures is about to slow (especially malls, hotels, and offices), a key question is how did the commercial real estate (CRE) investment boom compare to the residential housing bubble?
The following graph shows residential investment compared to investment in non-residential structures (excluding Power and Petroleum exploration) as a percent of GDP since 1960. All data from the BEA.
Note: Residential investment is primarily single family structures, multi-family structures, commissions, and home improvement.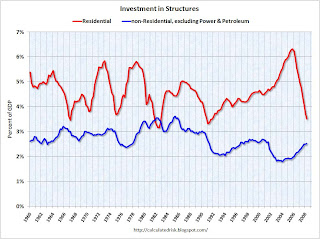 Click on graph for larger image in new window.
The recent housing boom and bust is very clear (in red). But this shows that the recent boom in non-residential investment (ex power and petro) was not as excessive as the housing bubble.
Also, the recent boom for CRE was much less than the S&L related boom in the '80s, and even less than the late '90s office boom.
Some areas of non-residential investment have been overbuilt (especially hotels and malls, and offices somewhat). But those looking for a collapse in CRE investment of the same size as the current residential investment bust are wrong.
Thursday, July 31, 2008
GDP and Investment
by Calculated Risk on 7/31/2008 10:09:00 AM
The BEA reported that GDP increased 1.9% in Q2 2008 at a seasonally adjusted annual rate (SAAR). But the underlying details - especially for investment - are weak.
Residential investment (RI) declined at a 15.6% (SAAR).
Investment in equipment and software declined 3.4% (SAAR).
The lone bright spot for investment was non-residential investment in structures. Non-RI structure investment increased at a 14.4% SAAR. But all evidence suggests this investment is about to slow sharply.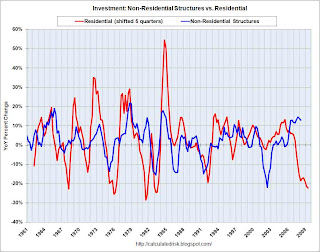 Click on graph for larger image in new window.
This first graph shows the typical relationship between residential investment and non-residential investment in structures. Note that residential investment is shifted 5 quarters into the future on the graph (non-residential investment usually follows residential by about 4 to 7 quarters).
The current non-residential boom has gone on a little longer than normal, probably for two reasons: 1) there was a slump in investment following the bursting of the tech bubble, and 2) loose lending standards kept non-residential investment lending strong until mid-year 2007, and it takes time to build non-residential structures.
All signs suggest that the bust is now here, and non-residential investment will probably be a drag on GDP for the next year or more. The second graph shows non-residential investment as a percent of GDP. This shows the current boom is even greater than the boom in the late '90s.
Some of the current investment boom is energy related, and I'll break out the three key areas that will soon go bust - office buildings, multimerchandise shopping, and lodging - as soon as the underlying detail tables are available. The third graph shows residential investment (RI) as a percent of GDP.
RI as a percent of GDP is at 3.5%, just above the cycle lows in 1982 and 1991. It is possible that RI, as a percent of GDP, will bottom later this year (or possibly in early 2009) since inventory is finally declining (housing starts are now below housing sales).
When RI finally bottoms, the good news is RI will no longer be a drag on GDP, but the bad news is RI will probably not recovery quickly because of the huge overhang of inventory. Unfortunately, by the time RI bottoms, non-residential investment will probably have taken over as a significant drag on GDP - suggesting the recession will linger.
Investment is usually the key to the economy, and investment remains weak.
Wednesday, April 30, 2008
Non-Residential Investment: Still the Key
by Calculated Risk on 4/30/2008 11:41:00 AM
After the Q4 GDP report was released, I wrote: Non-Residential Investment: The Key?
The good economic news in the Q4 GDP report was that non-residential investment was still positive. Investment in non-residential structures increased at a very robust 15.8% annualized real rate. And investment in equipment and software increased at a more modest 3.8% annualized real rate. This non-residential investment is probably the key (along with consumer spending) on how weak the economy will be in 2008.As I highlighted this morning, the non-residential investment news has turned negative in Q1 2008. Investment in non-residential structures was off 6.2% at an annualized rate, and investment in equipment and software investment declined 0.7%.
This is the normal historical pattern: residential investment leads non-residential investment, and all signs point to a sharp investment slump in 2008, especially in non-residential structures.
 This graph shows the YoY change in Residential Investment and investment in Non-residential Structures.
Note that residential investment (RI) is shifted 5 quarters into the future. The typical lag between RI and non-RI structures is 4 to 8 quarters.
Although the year-over-year change is still positive, this will probably turn negative in Q2 or Q3.
Since non-residential investment is highly correlated with recessions, this is a strong indicator that the U.S. economy is now in or near recession.
Q1 GDP Increases 0.6%
by Calculated Risk on 4/30/2008 08:51:00 AM
The Bureau of Economic Analysis reports that the U.S. economy grew at a 0.6% annual real rate in Q1 2006, mostly because of a buildup in inventories. Without the unwanted buildup in inventory, GDP would have been negative, suggesting the economy is in recession.
Consumer spending was up 1.0% at an annual rate, with services up 3.4% (the two month method predicted 1% PCE growth in Q1), and investment spending was off in all categories: residential investment off -26.7%, non-residential structures off -6.2%, and equipment and software investment off -0.7%. Click on graph for larger image.
This graph shows residential investment (RI) as a percent of GDP since 1960. RI as a percent of GDP is now at 3.8%, still well above the investment lows in 1982 (3.15%) and 1991 (3.3%). RI will probably decline further over the next few quarters.
Perhaps more important for the economy is that investment in equipment and software, and investment in non-residential structures, both turned negative in Q1. This is important because business investment slumps are highly correlated with the beginning of a recession. The second graph shows non-residential investment in structures as a percent of GDP since 1960.
Non-RI structure investment has finally turned negative, and will probably decline sharply during 2008. See CRE Bust: How Deep, How Fast?
More on investment later.
Thursday, April 17, 2008
Investment Matters
by Calculated Risk on 4/17/2008 02:19:00 PM
Recently many companies have announced plans to cut capital spending in 2008. This probably means non-residential fixed investments will decline in 2008, as compared to 2007.
This decline in investment is an important indicator for the economy, since changes in fixed investment correlate very well with GDP. The first graph shows the change in real GDP and Private Fixed Investment over the preceding four quarters through Q4 2007. (Source: BEA Table 1.1.1) (note these are year-over-year changes, not quarter-by-quarter).  Click on graph for larger image.
The red line is the year-over-year change in fixed investment, and the blue line (scale on left axis) is the year-over-year change in GDP. Correlation is 79%.
Residential investment is the best indicator of a future recession, but that has been flashing a recession warning for some time. This is why I've been so focused lately on non-residential investment, especially on commercial real estate, to determine that the recession has started. (also consumer spending - but that is a different post). The second graph shows two components of private fixed investment: residential (shifted 5 quarters into the future) and nonresidential structures.
This graphs shows something very interesting: in general, residential investment leads nonresidential structure investment. There are periods when this observation doesn't hold - like '95 when residential investment fell and the growth of nonresidential structure investment remained strong.
Another interesting period was in 2001 when nonresidential structure investment fell significantly more than residential investment. Obviously the fall in nonresidential structure investment was related to the bursting of the stock market bubble.
However, the typical pattern is residential investment leads non-residential structure investment. The normal pattern would be for investment in non-residential structures to have turned negative now.
And based on construction spending, anecdotal stories, and the most recent Fed loan survey, it appears the non-residential structure investment bust is here.
Here is a graph based on the Fed senior loan officer survey in January: The January 2008 Senior Loan Officer Opinion Survey on Bank Lending Practices
Note: the April survey should be released in early May. Of particular interest is the record increase in tighter lending standards for Commercial Real Estate (CRE) loans. This graph compares investment in non-residential structure with the Fed's loan survey results for lending standards (inverted) and CRE loan demand.
This is strong evidence of an imminent slump in non-residential structure investment.
Monday, February 25, 2008
Lowe's Same Store Sales Sequentially Worse
by Calculated Risk on 2/25/2008 10:49:00 AM
This morning, Lowe's reported same-store sales declined 7.6% for the quarter.
But sequentially sales are even worse.
From the Lowe's conference call:
Same Store sales fell 4% in November (YoY)
Same store sales fell 9% in December
Same store sales fell 11% in January
CEO Niblock said he was "a bit surprised" by the weakness.
Lowe's Warns: "next several quarters will be challenging"
by Calculated Risk on 2/25/2008 09:19:00 AM
From the WSJ: Lowe's Posts Lower Net Amid Housing Downturn
Lowe's Cos.'s fiscal fourth-quarter net income slumped 33% on continued sales weakness, which the home-improvement retailer expected to persist for several more quarters.In an earlier post, I noted that real home improvement spending had held up pretty well.
... same-store sales declined 7.6%.
Chairman and Chief Executive Robert A. Niblock said sales were below expectations "as we faced an unprecedented decline in housing turnover, falling home prices in many areas and turbulent mortgage markets that impacted both sentiment related to home improvement purchases as well as consumers' access to capital."
He went on to say "the next several quarters will be challenging on many fronts as industry sales are likely to remain soft."
This graph shows the major components of residential investment (RI) normalized by GDP.
 Click on graph for larger image.
The largest component of RI is investment in new single family structures. This includes both homes built for sale, and homes built by owner.
The second largest component of RI is home improvement. This investment could be seriously impacted by declining mortgage equity withdrawal (MEW) over the next few quarters.
This data is from the Bureau of Economic Analysis (BEA), supplemental tables. (see Section 5: Table 5.4.5AU. Private Fixed Investment in Structures by Type, near the bottom).
Sunday, February 03, 2008
Components of Residental Investment
by Calculated Risk on 2/03/2008 04:06:00 PM
This is a follow up to the previous post regarding investment in home improvement.
This data is from the Bureau of Economic Analysis (BEA), supplemental tables. (see Section 5: Table 5.4.5AU. Private Fixed Investment in Structures by Type, near the bottom)
This graph shows the major components of residential investment (RI) normalized by GDP. Click on graph for larger image.
The largest component of RI is investment in new single family structures. This includes both homes built for sale, and homes built by owner.
The second largest component of RI is home improvement. As I noted in the previous post (using inflation adjusted dollars), investment in home improvement has held up pretty well. This investment could be seriously impacted by declining mortgage equity withdrawal (MEW) over the next few quarters.
The third largest category (at least in recent years), has been broker's commissions. This is the only component of existing home sales included in residential investment, and the decline in broker's commissions follows the decline in existing home sales.
The only other major component of RI is multifamily structures. This includes apartments and some condo projects.
Most of the focus has been on declining investment in single family structures (declining new home sales) and broker's commissions (declining existing home sales). But so far, with strong MEW, home improvement has held up well.
Rob sent me this description of what he is seeing in the housing market in Western Washington state:
I want to echo the observations of the Bay Area home shopper.I'm sure these "pimped out" homes are all across the country. And MEW has probably been the primary source of funds for many of these homeowners. Now that it appears MEW lending is being tightened - especially for Home Equity Lines of Credit - this will probably impact home improvement spending.
...
In nearly every middle class house listing I view, I see upgraded kitchens with granite (usually slab) counter tops . I also see matching stainless steel appliances and high end cabinets.
Now, these houses and condos are all less than 15 years old, so the owners were not generally replacing worn out or really out-of-style stuff. And these houses did not come equipped like this. I also see living rooms and family rooms that have complete, matching sets of furniture, probably from places like Pottery Barn. Not just one or two pieces, but _every_ single_ piece_. It's like all living, dining and family room furniture was swapped out at exactly the same time. I contrast this with how houses used to be furnished: a piece here, a piece there, a gift from relatives, etc., gradually over the years. No more. Everyone is going for the "showroom" look. ...
I even see this phenomenon in the low-end condo development where I bought my "starter home" back in 1993. ... when I sold my unit in 2006 after renting it out for a few years, it was "stock." No new cabinets, appliances, granite counter tops, wood or laminate flooring, simple fixtures, etc. And it was in great shape. Well, I have found that many of the units in that development have also been "pimped out" with "designer paint schemes," granite counters, new kitchen cabinets, $300 faucets and appliances, pergo flooring, fancy new mill work, etc.
These condos were built in 1993 and 1994. The counters, cabinets, mill work and most appliances should have been in reasonably good condition and not too dated in appearance. Since those folks have very modest incomes, I know where the money [probably] came from.
Home Improvement Investment
by Calculated Risk on 2/03/2008 01:46:00 PM
I heard from a prospective homebuyer in the Bay Area of California this morning. She noted that almost every house she has viewed had recently remodeled kitchens and baths.
And that brings up an interesting point: Real spending on home improvement has held up pretty well so far (only off 2% in real terms from the peak). If this housing bust is similar to the early '80s or '90s, real home improvement investment will slump 15% to 20%. 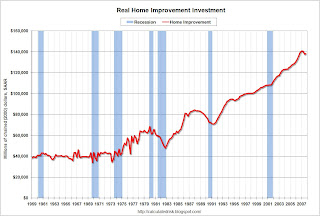 Click on graph for larger image.
This graph shows real home improvement investment (2000 dollars) since 1959. Recessions are in light blue (source: BEA)
Real spending on home improvement increased slightly in Q4 2007 after declining the previous two quarters. With declining MEW, it is very possible that home improvement spending will slump like in the early '80s and '90s.
Wednesday, January 30, 2008
Non-Residential Investment: The Key?
by Calculated Risk on 1/30/2008 10:15:00 AM
Residential investment, as a percent of GDP, fell to 4.16% in Q4 2007, and is now below the median of the last 50 years (about 4.56%). Click on graph for larger image
This graph shows Residential Investment (RI) as a percent of GDP since 1960. Based on previous downturns, RI as a percent of GDP will probably bottom in the 3% to 4% range (probably below 3.5% because of the current huge excess supply of housing units).
Simply extrapolating out the current trajectory, RI as a percent of GDP would then bottom in the 2nd half of 2008. Of course, given the magnitude of the boom, RI as a percent of GDP could fall below 3% and not bottom until sometime in 2009.
But we all know housing is getting crushed.
The good economic news in the Q4 GDP report was that non-residential investment was still positive. Investment in non-residential structures increased at a very robust 15.8% annualized real rate. And investment in equipment and software increased at a more modest 3.8% annualized real rate. This non-residential investment is probably the key (along with consumer spending) on how weak the economy will be in 2008.
This following graphs compare residential investment with both of the components of non-residential investment: structures, and equipment and software.
Important Note: On both graphs, residential investment is shifted into the future. Historically investment in non-residential structures follows residential investment by about 5 quarters, and investment in equipment and software follows residential investment by about 3 quarters. For more on these lags, see: Investment Lags.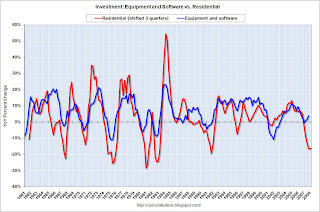
The second graph shows the YoY change in Residential Investment (shifted 3 quarters into the future) and investment in equipment and software. The normal pattern would be for investment in equipment and software to have turned negative.
Instead investment in equipment and software is still positive.
The third graph shows the YoY change in Residential Investment (shifted 5 quarters into the future) and investment in Non-residential Structures. The normal pattern would be for investment in non-residential structures to turn negative now.
Once again, investment in non-residential structures was still strong in Q4. It is possible that the big investment slump in the early '00s has left many markets with too little supply of commercial and office buildings (and other non-residential structures). If true, then investment in non-residential structures decoupled (at least for a short period) from the typical pattern.
However, there is growing evidence that investment in non-residential structures is now slumping. We will know more when the Fed releases the January Senior Loan Officer Opinion Survey on Bank Lending Practices.
For equipment and software, I think we are still in a technology fueled productivity boom, so it is possible that investment in software and equipment will stay somewhat positive, and not follow residential investment. This is what happened in the '90s (second graph); residential investment slumped somewhat, but investment in equipment and software stayed strong.
Of course, if non-residential investment falters, the U.S. will almost certainly be in a recession.
Wednesday, October 31, 2007
Q3 Structure Investment
by Calculated Risk on 10/31/2007 11:34:00 AM
According to the BEA, Residential Investment declined at a 20.1% annual rate in Q3 2007.
The first graph shows Residential Investment (RI) as a percent of GDP since 1960. Click on graph for larger image
Residential investment, as a percent of GDP, has fallen to 4.51% in Q3 2007, and is now below the median for the last 50 years of 4.56%.
Although RI has fallen significantly from the cycle peak in 2005 (6.3% of GDP in Q3 2005), RI as a percent of GDP is still well above all the significant troughs of the last 50 year (all below 4% of GDP). Based on these past declines, RI as a percent of GDP could still decline significantly over the next year or so.
The fundamentals of supply and demand also suggest further significant declines in RI.
Non Residential Structures Investment in non-residential structures continues to be very strong, increasing at a 12.3% annualized rate in Q3 2007.
Investment in non-residential structures is now 3.44% of GDP, above the recent peak in 2001. Whereas RI declines prior to a recession, non-residential investment in structures tends to peak during a recession.
Monday, September 24, 2007
Housing: Soft "repairs, maintenance and improvement markets"
by Calculated Risk on 9/24/2007 02:44:00 PM
From The Times: Wolseley's fresh alert on US housing market
Wolseley, the plumbing and heating engineer, which makes half its income in America, gave warning today that revenues of its US building materials business have collapsed by almost 75 per cent.Real spending on home improvement has held up pretty well so far. If this housing bust is similar to the early '80s or '90s, real home improvement investment will slump 15% to 20%.
It has eliminated 3,500 staff and shut 46 branches.
...
Chip Hornsby, the chief executive, said that there were no signs of a turnaround in the residential housing market and that "the repairs, maintenance and improvement market is now beginning to soften".
 Click on graph for larger image.
This graph shows real home improvement investment (2000 dollars) since 1959. Recessions are in gray (source: BEA)
Although real spending declined slightly in Q2 2007, home improvement spending has held up pretty well compared to the other components of Residential Investment. With declining MEW, it is very possible that home improvement spending will slump like in the early '80s and '90s.


