by Calculated Risk on 9/10/2008 09:55:00 PM
Wednesday, September 10, 2008
Investment: Residential vs. Non-Residential
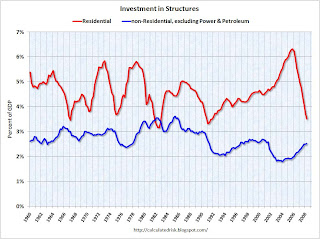
Since investment in non-residential structures is about to slow (especially malls, hotels, and offices), a key question is how did the commercial real estate (CRE) investment boom compare to the residential housing bubble?
The following graph shows residential investment compared to investment in non-residential structures (excluding Power and Petroleum exploration) as a percent of GDP since 1960. All data from the BEA.
Note: Residential investment is primarily single family structures, multi-family structures, commissions, and home improvement. Click on graph for larger image in new window.
The recent housing boom and bust is very clear (in red). But this shows that the recent boom in non-residential investment (ex power and petro) was not as excessive as the housing bubble.
Also, the recent boom for CRE was much less than the S&L related boom in the '80s, and even less than the late '90s office boom.
Some areas of non-residential investment have been overbuilt (especially hotels and malls, and offices somewhat). But those looking for a collapse in CRE investment of the same size as the current residential investment bust are wrong.


