by Calculated Risk on 12/23/2008 10:01:00 AM
Tuesday, December 23, 2008
New Home Sales in November
The Census Bureau reports, New Home Sales in November were at a seasonally adjusted annual rate of 407 thousand. This is the lowest sales rate since 1982.  Click on graph for larger image in new window.
The first graph shows monthly new home sales (NSA - Not Seasonally Adjusted).
Notice the Red columns for 2008. This is the lowest sales for November since 1981. (NSA, 28 thousand new homes were sold in November 2008, 27 thousand were sold in November 1981).
As the graph indicates, sales in 2008 are substantially worse than the previous years. The second graph shows New Home Sales vs. recessions for the last 45 years. New Home sales have fallen off a cliff.
Sales of new one-family houses in November 2008 were at a seasonally adjusted annual rate of 407,000, according toAnd one more long term graph - this one for New Home Months of Supply.
estimates released jointly today by the U.S. Census Bureau and the Department of Housing and Urban Development.
This is 2.9 percent below the revised October of 419,000 and is 35.3 percent below the November 2007 estimate of 629,000.
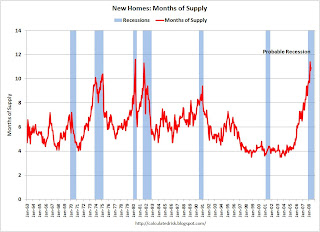
 "Months of supply" is at 11.5 months.
 The months of supply for October was revised up to 11.8 months - the ALL TIME RECORD!
For new homes, both sales and inventory are falling quickly.
And on inventory:
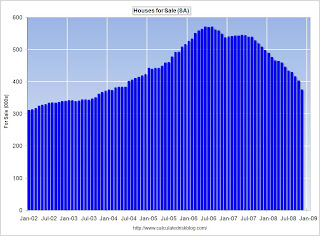
TheInventory numbers from the Census Bureau do not include cancellations and cancellations are falling, but are still near record levels. Note that new home inventory does not include many condos (especially high rise condos), and areas with significant condo construction will have much higher inventory levels.
seasonally adjusted estimate of new houses for sale at the end of November was 374,000. This represents a supply of 11.5 months at the current sales rate.
This is a another very weak report. I'll have some charts on existing home sales and more on new home sales later today ...
Wednesday, November 26, 2008
October New Home Sales: Lowest Since 1982
by Calculated Risk on 11/26/2008 10:00:00 AM
The Census Bureau reports, New Home Sales in October were at a seasonally adjusted annual rate of 433 thousand. This is the lowest sales rate since 1982.  Click on graph for larger image in new window.
The first graph shows monthly new home sales (NSA - Not Seasonally Adjusted).
Notice the Red columns for 2008. This is the lowest sales for October since 1981. (NSA, 34 thousand new homes were sold in October 2008, 29 thousand were sold in October 1981).
As the graph indicates, sales in 2008 are substantially worse than the previous years. The second graph shows New Home Sales vs. recessions for the last 45 years. New Home sales have fallen off a cliff.
Sales of new one-family houses in October 2008 were at a seasonally adjusted annual rate of 433,000, according toAnd one more long term graph - this one for New Home Months of Supply.
estimates released jointly today by the U.S. Census Bureau and the Department of Housing and Urban Development.
This is 5.3 percent below the revised September of 457,000 and is 40.1 percent below the October 2007 estimate of 723,000.
 "Months of supply" is at 11.1 months.
 Sales are falling quickly, but inventory is declining too, so the months of supply is slightly lower than the peak of 11.4 months in August 2008.
The all time high for Months of Supply was 11.6 months in April 1980.
And on inventory:

TheInventory numbers from the Census Bureau do not include cancellations and cancellations are falling, but are still near record levels. Note that new home inventory does not include many condos (especially high rise condos), and areas with significant condo construction will have much higher inventory levels.
seasonally adjusted estimate of new houses for sale at the end of October was 381,000. This represents a supply of 11.1 months at the current sales rate.
This is a another very weak report. I'll have more later today ...
Monday, October 27, 2008
September New Home Sales: Lowest September Since 1981
by Calculated Risk on 10/27/2008 10:00:00 AM
According to the Census Bureau report, New Home Sales in September were at a seasonally adjusted annual rate of 464 thousand. Sales for August were revised down slightly to 452 thousand.
Note that the most recent wave of the credit crisis started in mid-September. Since New Home sales are reported when the contract is signed, September sales were only partially impacted by the credit crisis. Click on graph for larger image in new window.
The first graph shows monthly new home sales (NSA - Not Seasonally Adjusted).
Notice the Red columns for 2008. This is the lowest sales for September since 1981. (NSA, 36 thousand new homes were sold in September 2008, 28 thousand were sold in September 1981).
As the graph indicates, sales in 2008 are substantially worse than the previous years. The second graph shows New Home Sales vs. recessions for the last 45 years. New Home sales have fallen off a cliff.
Sales of new one-family houses in September 2008 were at a seasonally adjusted annual rate of 464,000, according to estimates released jointly today by the U.S. Census Bureau and the Department of Housing and Urban Development.And one more long term graph - this one for New Home Months of Supply.
This is 2.7 percent above the revised August rate of 452,000, but is 33.1 percent below the September 2007 estimate of 694,000.
 "Months of supply" is at 10.4 months.
 Note that this doesn't include cancellations, but that was true for the earlier periods too. Sales are falling quickly, but inventory is declining too, so the months of supply is slightly lower than the peak of 11.4 months in August 2008.
The all time high for Months of Supply was 11.6 months in April 1980.
And on inventory:

The seasonally adjusted estimate of new houses for sale at the end of September was 394,000. This represents a supply of 10.4 months at the current sales rateInventory numbers from the Census Bureau do not include cancellations and cancellations are falling, but are still near record levels. Note that new home inventory does not include many condos (especially high rise condos), and areas with significant condo construction will have much higher inventory levels.
As I noted a couple of months ago, I now expect that 2008 will be the peak of the inventory cycle for new homes, and could be the bottom of the sales cycle for new home sales. But the news is still grim for the home builders. Usually new home sales rebound fairly quickly following a bottom (see the 2nd graph above), but this time I expect a slow recovery because of the overhang of existing homes for sales (especially distressed properties).
This is a another very weak report.
Thursday, September 25, 2008
August New Home Sales: Lowest August Since 1982
by Calculated Risk on 9/25/2008 10:10:00 AM
According to the Census Bureau report, New Home Sales in August were at a seasonally adjusted annual rate of 460 thousand. Sales for July were revised up slightly to 520 thousand.  Click on graph for larger image in new window.
The first graph shows monthly new home sales (NSA - Not Seasonally Adjusted).
Notice the Red columns for 2008. This is the lowest sales for August since 1982. (NSA, 39 thousand new homes were sold in August 2008, 36 thousand were sold in August 1982).
As the graph indicates, sales in 2008 are substantially worse than the previous years.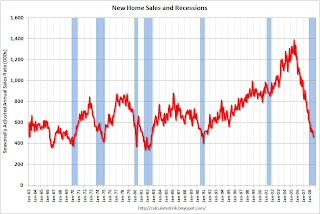 The second graph shows New Home Sales vs. recessions for the last 45 years. New Home sales have fallen off a cliff.
Sales of new one-family houses in August 2008 were at a seasonally adjusted annual rate of 460,000, according to estimates released jointly today by the U.S. Census Bureau and the Department of Housing and Urban Development. This is 11.5 percent below the revised July rate of 520,000 and is 34.5 percent below the August 2007 estimate of 702,000.And one more long term graph - this one for New Home Months of Supply.
 "Months of supply" is at 10.9 months.
 Note that this doesn't include cancellations, but that was true for the earlier periods too. Sales are falling quickly, but inventory is declining too, so the months of supply is slightly lower than the peak of 11.2 months in March 2008.
The all time high for Months of Supply was 11.6 months in April 1980.
And on inventory:

The seasonally adjusted estimate of new houses for sale at the end of August was 408,000. This represents a supply of 10.9 months at the current sales rate.Inventory numbers from the Census Bureau do not include cancellations and cancellations are falling, but are still near record levels. Note that new home inventory does not include many condos (especially high rise condos), and areas with significant condo construction will have much higher inventory levels.
As I noted last month, I now expect that 2008 will be the peak of the inventory cycle (in terms of months of supply) and could be the bottom of the sales cycle for new home sales. But the news is still grim for the home builders. Usually new home sales rebound fairly quickly following a bottom (see the 2nd graph above), but this time I expect a slow recovery because of the overhang of existing homes for sales (especially distressed properties). If the recession is more severe than I currently expect, new home sales might fall even further.
This is a very weak report, but as grim as the news is for new home sales, I remain more pessimistic about existing home sales, and existing home prices, than new home sales.
Tuesday, August 26, 2008
July New Home Sales
by Calculated Risk on 8/26/2008 10:00:00 AM
According to the Census Bureau report, New Home Sales in July were at a seasonally adjusted annual rate of 515 thousand. Sales for June were revised down to 503 thousand. 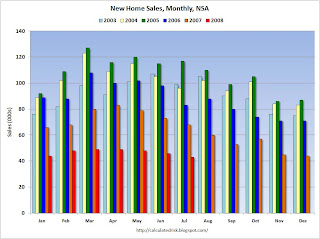 Click on graph for larger image in new window.
The first graph shows monthly new home sales (NSA - Not Seasonally Adjusted).
Notice the Red columns for 2008. This is the lowest sales for July since the recession of '91. (NSA, 43 thousand new homes were sold in July 2008, the same as in July '91).
As the graph indicates, there was no spring selling season in 2008.
********************************  The second graph shows New Home Sales vs. recessions for the last 45 years. New Home sales have fallen off a cliff.
 Sales of new one-family houses in July 2008 were at a seasonally adjusted annual rate of 515,000, according to estimates released jointly today by the U.S. Census Bureau and the Department of Housing and Urban Development. This is 2.4 percent (±11.6%)* above the revised June rate of 503,000, but is 35.3 percent (±7.3%) below the July 2007estimate of 796,000.
And one more long term graph - this one for New Home Months of Supply. "Months of supply" is at 10.1 months.
Note that this doesn't include cancellations, but that was true for the earlier periods too. The months of supply is down from the peak of 11.2 months in March 2008.
The all time high for Months of Supply was 11.6 months in April 1980.
And on inventory:
The seasonally adjusted estimate of new houses for sale at the end of July was 416,000. This represents a supply of 10.1months at the current sales rate.
Inventory numbers from the Census Bureau do not include cancellations and cancellations are falling, but still near record levels. Note that new home inventory does not include many condos (especially high rise condos), and areas with significant condo construction will have much higher inventory levels.
I now expect that 2008 will be the peak of the inventory cycle (in terms of months of supply) and could be the bottom of the sales cycle for new home sales. But the news is still grim for the home builders. Usually new home sales rebound fairly quickly following a bottom (see the 2nd graph above), but this time I expect a slow recovery because of the overhang of existing homes for sales (especially distressed properties). If the recession is more severe than I currently expect, new home sales might fall even further.
Looking forward, I'm much more pessimistic about existing home sales, and existing home prices, than new home sales.
Thursday, August 21, 2008
Borrowing Trouble: Merrill Lynch on Housing
by Calculated Risk on 8/21/2008 11:25:00 AM
Merrill Lynch released a research note earlier this week: Wall-to-wall homes. This piece was widely quoted, and - as bearish as I am on housing - I believe this analysis is incorrect.
Starting with the 3rd paragraph:
"Single starts dropped to 641k in July, the lowest since January 1991, but even this is well ahead of the pace of sales."Yes and no. It is correct that starts of one unit structures declined to 641K (SAAR) in July according to the Census Bureau. However it is a mistake to compare one unit starts directly with new home sales. The main problem is one unit starts include homes built for or directly by owners. The quarterly data from the Census Bureau mostly resolves this problem, and the quarterly data shows that starts are now running below new home sales - so inventory of new homes is declining (Note: this needs to be adjusted for cancellations too, but even then new home inventory is declining sharply).
More Merrill:
"Given our expectation for sales to decline by 1% in July to 411k units, we expect months’ supply to drop to 9.4 months from 10.4 in June."I think Merrill meant they expect new home inventory to decline to 411K units in July or about 3% (from 426K SA in June). That would put the months of supply in July near Merrill's estimate of 9.4 months - a sharp decline from the recent high of 11.2 months in March 2008.
This takes us to Merrill's first paragraph:
"[H]ome building needs to contract by another 30% ... and stay in that range through at least the end of 2009 in order to get months’ supply down, in our view."This begs the question: down to what? Merrill just argued (correctly in my view) that months of supply will probably decline in July, but in this statement they are arguing that starts need to fall another 30% to get months of supply down. Really?
 Click on graph for larger image in new window.
This graph shows the months of supply metric over the last 45 years. During the boom, the months of supply was around 4, but in more normal markets, the months of supply is usually around 5 to 6.
At the current rate of starts (single family, built for sale) and new home sales, the months of supply will probably decline to the low 8s by the end of 2008. That is about half way to a normal market! Yes, new home sales will probably decline a little further because of tighter lending standards, but starts will probably fall further too (based on permits) - so the bottom line is I expect inventory and months of supply to continue to decline for the rest of 2008.
The biggest problem for home builders is the huge overhang of existing homes for sale, especially distressed properties. This will keep a lid on new home sales for some time - so there won't be much of a rebound in sales, and the housing correction will probably look like an "L" (sharp drop and then flat). But, it is clear that the new home inventory correction is already under way.
And a final excerpt from Merrill:
"Housing completions remained elevated at 1035k in July (791k singles and 244k multi units), which will not help the supply situation ..."This is just confusing. Completions are important for looking at residential construction employment, but they are not as useful for supply. This is because most homes are sold early in the process, before they are started or early in the construction process. Starts are better for analyzing supply - or completions with a six month lag (time to build a home), and once again, you can't compare starts (or completions) directly to sales because many homes are not "built for sale".
I remain bearish on housing in general, and there is no question there are many negatives for the housing market. I expect prices to fall for some time in the bubble markets because prices are still too high relative to incomes and rents, and because of the huge overhang of inventory, especially REOs and other distressed properties. There are also serious problems building in the Alt-A market, see Tanta's Subprime and Alt-A: The End of One Crisis and the Beginning of Another and Reset Vs. Recast, Or Why Charts Don't Match. And there are well publicized problems with Fannie and Freddie, and other lenders are still tightening standards.
But we don't need to borrow trouble. Single family starts (built for sale) have fallen enough that new home inventory and months of supply is now declining.
Sunday, July 27, 2008
Graphs: June New Home Sales
by Calculated Risk on 7/27/2008 09:01:00 AM
Since I was out of town on Friday, here is a somewhat belated look at the New Home sales report from the Census Bureau.
According to the Census Bureau report, New Home Sales in June were at a seasonally adjusted annual rate of 530 thousand. Sales for May were revised up to 533 thousand (from 512 thousand).  Click on graph for larger image in new window.
The first graph shows monthly new home sales (NSA - Not Seasonally Adjusted).
Notice the Red columns for 2008. This is the lowest sales for June since the recession of '91. (NSA, 49 thousand new homes were sold in June 2008, just above the '91 recession low of 47 thousand homes).
As the graph indicates, there was no spring selling season in 2008. The second graph shows New Home Sales vs. recessions for the last 45 years. New Home sales have fallen off a cliff.
Sales of new one-family houses in June 2008 were at a seasonally adjusted annual rate of 530,000, according to estimates released jointly today by the U.S. Census Bureau and the Department of Housing and Urban Development. This is 0.6 percent below the revised May rate of 533,000 and is 33.2 percent below the June 2007 estimate of 793,000.And one more long term graph - this one for New Home Months of Supply.
 "Months of supply" is at 10.0 months.
 Note that this doesn't include cancellations, but that was true for the earlier periods too. The months of supply is down from the peak of 11.2 months in March 2008.
The all time high for Months of Supply was 11.6 months in April 1980.
And on inventory:

The seasonally adjusted estimate of new houses for sale at the end of June was 426,000. This represents a supply of 10.0 months at the current sales rate.Inventory numbers from the Census Bureau do not include cancellations - and cancellations are near record levels. Actual New Home inventories are probably much higher than reported - my estimate is around 90K higher. Note that new home inventory does not include many condos (especially high rise condos), and areas with significant condo construction will have much higher inventory levels.
Still the 426,000 units of inventory is well below the levels of the last year, and inventory is now falling fairly quickly. It appears the home builders are selling more homes than they are building, and it is very possible that months of supply has peaked for this cycle.
I now expect that 2008 will be the peak of the inventory cycle (in terms of months of supply) and could be the bottom of the sales cycle for new home sales. But the news is still grim for the home builders. Usually new home sales rebound fairly quickly following a bottom (see the 2nd graph above), but this time I expect a slow recovery because of the overhang of existing homes for sales (especially distressed properties). If the recession is more severe than I currently expect, new home sales might fall even further.
Looking forward, I'm much more pessimistic about existing home sales, and existing home prices, than new home sales.
Friday, July 25, 2008
June New Home Sales
by Calculated Risk on 7/25/2008 10:00:00 AM
Note: the graphs will be posted this weekend when I return home from the real estate conference.
From the Census Bureau: New Residential Sales in June 2008
Sales of new one-family houses in June 2008 were at a seasonally adjusted annual rate of 530,000, according to estimates released jointly today by the U.S. Census Bureau and the Department of Housing and Urban Development. This is 0.6 percent (±11.3%)* below the revised May rate of 533,000 and is 33.2 percent (±8.8%) below the June 2007 estimate of 793,000.Seasonally adjusted inventory declined to 426 thousand, and the months of supply is down slightly to 10 months.
I'll have much more this weekend. Note that sales for last month were revised up from 512,000 to 533,000. This is not a horrible report for sales and inventory.
I miss my graph tools! Best to all.
Wednesday, June 25, 2008
May New Home Sales: 512K Annual Rate
by Calculated Risk on 6/25/2008 10:00:00 AM
According to the Census Bureau report, New Home Sales in May were at a seasonally adjusted annual rate of 512 thousand. Sales for April were revised down slightly to 525 thousand (from 526 thousand). Click on graph for larger image in new window.
The first graph shows monthly new home sales (NSA - Not Seasonally Adjusted).
Notice the Red columns for 2008. This is the lowest sales for May since the recession of '91.
As the graph indicates, the spring selling season has never really started. The second graph shows New Home Sales vs. recessions for the last 45 years. New Home sales have fallen off a cliff.
Sales of new one-family houses in May 2008 were at a seasonally adjusted annual rate of 512,000, according to estimates released jointly today by the U.S. Census Bureau and the Department of Housing and Urban Development. This is 2.5 percent below the revised April rate of 525,000 and is 40.3 percent below the May 2007 estimate of 857,000.And one more long term graph - this one for New Home Months of Supply.
 "Months of supply" is at 10.9 months. Note that this doesn't include cancellations, but that was true for the earlier periods too.
The all time high for Months of Supply was 11.6 months in April 1980.
Once again, the current recession is "probable" and hasn't been declared by NBER.
And on inventory:
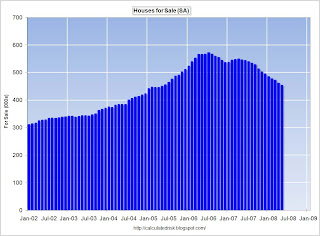
The seasonally adjusted estimate of new houses for sale at the end of May was 453,000. This represents a supply of 10.9 months at the current sales rate.Inventory numbers from the Census Bureau do not include cancellations - and cancellations are near record levels. Actual New Home inventories are probably much higher than reported - my estimate is just under 100K higher.
Still, the 453,000 units of inventory is below the levels of the last year, and it appears that even including cancellations, inventory is now falling.
This is another very weak report for New Home sales and I'll have more later.
Tuesday, May 27, 2008
April New Home Sales
by Calculated Risk on 5/27/2008 10:00:00 AM
According to the Census Bureau report, New Home Sales in April were at a seasonally adjusted annual rate of 526 thousand. Sales for March were revised down to 509 thousand.  Click on graph for larger image.
Sales of new one-family houses in April 2008 were at a seasonally adjusted annual rate of 526,000, according to estimates released jointly today by the U.S. Census Bureau and the Department of Housing and Urban Development. This is 3.3 percent above the revised March rate of 509,000, but is 42.0 percent below the April 2007 estimate of 907,000.This graph shows New Home Sales vs. recessions for the last 45 years. New Home sales were falling prior to every recession, with the exception of the business investment led recession of 2001.
New home sales in April were the lowest April since 1991. This is what we call Cliff Diving!
 The second graph shows monthly new home sales (NSA - Not Seasonally Adjusted).
Notice the Red columns for 2008. This is the lowest sales for April since the recession of '91.
As the graph indicates, the spring selling season has never really started.
And one more long term graph - this one for New Home Months of Supply.
 "Months of supply" is at 10.6 months; the highest level since 1981. Note that this doesn't include cancellations, but that was true for the earlier periods too.
The all time high for Months of Supply was 11.6 months in April 1980.
Once again, the current recession is "probable" and hasn't been declared by NBER.
And on inventory:
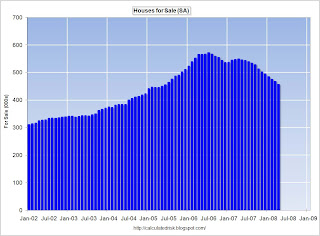
The seasonally adjusted estimate of new houses for sale at the end of April was 456,000. This represents a supply of 10.6 months at the current sales rate.Inventory numbers from the Census Bureau do not include cancellations - and cancellations are near record levels. Actual New Home inventories are probably much higher than reported - my estimate is just under 100K higher.
Still, the 456,000 units of inventory is below the levels of the last year, and it appears that even including cancellations, inventory is now falling.
This is another very weak report for New Home sales.
Wednesday, May 14, 2008
Downtown Chicago Condo Numbers
by Calculated Risk on 5/14/2008 07:58:00 PM
As I mentioned in the previous post, most condos are not included in the new home sales and inventory numbers from the Census Bureau (they are included in housing starts).
Here are some numbers for the Chicago market from the Chicago Tribune: Record condo numbers to saturate downtown (hat tip Lee)
Gail Lissner, vice president of Appraisal Research Counselors, said 2008 is the biggest year so far for downtown condos. Her firm says 5,984 units will come on the market this year. That compares with 4,794 last year and a projected 4,160 next year.Those sales numbers are quarterly, so 1,200 sales in Q1 2007 was reasonable compared to the 4,794 new condos added last year. But with close to 6,000 units being added this year, and sales of only 201 units in Q1, there is a serious oversupply - with more units coming in 2009.
Yet buyers are not showing up.
Sales of newly built downtown condominiums plummeted by about 83 percent during the first quarter, to 201 units from 1,207 units a year earlier, according to a report to be released Wednesday by Appraisal Research Counselors.
There are probably many areas with similar or worse numbers for new condos - like San Diego, Miami, Las Vegas, Orange County and more.
Condo Stats and Negative Externalities
by Calculated Risk on 5/14/2008 05:29:00 PM
The NY Times has an article on the negative externalities of some Condo Life: Foreclosures, Higher Fees and Mowing the Lawn
When people buy condos, they expect their monthly fees will cover many of the responsibilities that they would otherwise have as single-family homeowners, like cutting the grass and paying the water bills. Now many find themselves nagging each other in the hallways to pay their assessments and adding special fees while haggling over chores. In Miami, Chicago and San Diego, condo owners are adjusting to the economic woes, sometimes by mowing themselves and working shifts for building security — all while lamenting their lost community.The article also mentions that condos are not included in some of the housing stats - something I've mentioned several times. Many condos (especially high rise) are not included in the new home sales and inventory report from the Census Bureau (they are included in housing starts).
Many of the numbers compiled on home sales specifically exclude condos, which account for one out of eight homes in the nation, and that missing data may be masking just how weak the housing market really is. Sales of existing condo units were down 26 percent in March from a year earlier, compared with an 18 percent decline for single-family homes, according to the National Association of Realtors.For those areas with a large number of high rise condos, the supply of housing units could be much higher than the Census Bureau statistics would indicate.
The pain in the condo market, mostly urban areas, may not only be deeper than the rest of the housing market during this downturn but more prolonged.
Wednesday, May 07, 2008
Housing: Another Day, Another WSJ Bottom Call
by Calculated Risk on 5/07/2008 12:09:00 PM
Brett Arends at the WSJ asks: Is Housing Slump at a Bottom?
[The following chart] from Wellesley College Prof. Karl E. Case, one of the leading experts on the housing market in the country. And it suggests we may be at, or near, the bottom of the housing crash.
... new housing starts have at last slumped below the seemingly magical one million mark. That happened in March. Every time that has happened in the last 50 years, it proved to be the bottom of a recession.
"It is really remarkable how much where we are today looks like the bottom we've had in the last three cycles," Mr. Case says. "Every time we've gone below a million starts, the market has cleared at that moment."
First, I think any article discussing the housing "bottom" should start by defining what they mean by "bottom". Are they talking about starts? New home sales? Residential investment? Housing prices? Or some other metric?
Most people think of the bottom in terms of price, and in most housing busts, starts, residential investment, and new home sales all bottom long before housing prices bottom. The linked article seems to confuse a bottom for housing starts with a bottom for housing prices, and that is incorrect.
Second, we can write the supply side of the equation as:
Supply = new units added - units sold + existing units for sale. Looking at just housing starts provides only one portion of the equation (this leaves out rental units too - a substitute product).
Here is a graph of inventory (new and existing) for sale at year end (March for 2008):
 Click on graph for larger image.
In the supply-demand equation for housing, prices will be under pressure until the total supply declines significantly. So even if housing starts are near a bottom, there will no quick recovery for starts, and prices will continue to decline, until the total inventory is reduced.
Tuesday, May 06, 2008
New Home Inventory and Cancellations
by Calculated Risk on 5/06/2008 03:44:00 PM
Inventory numbers from the Census Bureau do not include cancellations - and although cancellation rates are still above normal, the rate has declined from the record levels of last year.
As examples, D.R. Horton reported a cancellation rate of 33% for the most recent quarter, down from 48% in the Fall of 2007. And Centex reported a cancellation rate of 29%, below the mid-30s of 2007.
Each builder has their own downpayment and cancellation policies. Some builders require much higher downpayments and therefore have lower cancellation rates. For Centex, a cancellation rate in the low 20s was normal during good times. For D.R. Horton, a cancellation rate below 20% was common during the boom.
Cancellation rates are important when analyzing the New Home data from the Census Bureau. What matters is the change in cancellation rates, not the absolute level. Falling cancellation rates mean the Census Bureau is probably underestimating sales, and underestimating the decline in inventory. This graph shows my adjusted inventory estimate using cancellation rates from several of the large public builders. This suggests that inventory levels are now declining. Unfortunately this number can only be calculated on a quarterly basis, and not until several of the homebuilders file their quarterly reports with the SEC.
My inventory estimate is 560 thousand (as opposed the Census Bureau reported 468 thousand) as of the end of March. This is actually positive news, since the inventory level decreased by 42 thousand in Q1 by this method. This also suggests the Census Bureau understated sales slightly in Q1.
Also note that most condominiums are not included in new home inventory (or new home sales) from the Census Bureau. Areas with significant condominium developments probably have higher levels of inventory.
Friday, April 25, 2008
Why Haven't Existing Home Sales Fallen Further?
by Calculated Risk on 4/25/2008 05:25:00 PM
The first graph compares New Home sales vs. Existing Home sales since January 1994.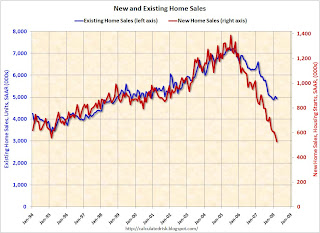 Click on graph for larger image.
Clearly new home sales have fallen faster than existing home sales.
Based on various reports, it appears new home builders cut their prices quicker than most existing home sellers. So why have new home sales fallen faster than existing home sales?
There could be a number of possible explanations:
Perhaps new homes were more overpriced than existing homes, so the larger price cuts haven't been enough to motivate buyers.
Or maybe there was more speculative buying in the new home market. During the boom, many buyers could put down 1% or less and hold a house for 6 to 9 months; essentially a call option on the house. But if that was the reason, wouldn't new home sales have increased quicker than existing home sales during the boom? It appears the ratio of sales tracked pretty closely from '94 through '05.
Or maybe all the REO sales (bank Real Estate Owned) are boosting the number of existing home transactions. Note: It is my understanding that banks taking possession of foreclosed properties are not counted in the NAR's existing home sales report, but the resale of REOs are counted.
Whatever the reason - and I'm always a little skeptical of the NAR's numbers - existing home sales are still above the normal range. The second graph shows annual existing home sales and year end inventory. As the NAR recently noted 2007 was the fifth highest sales year on record.
Note: for 2008 I used the March sales and inventory numbers. All other numbers are annual sales, and year-end inventory.
If the red columns (inventory) is as high as the blue column (sales) - something I expect to happen this summer - then the "months of supply" number will be 12. 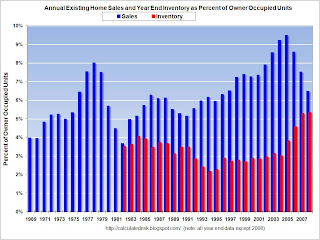
The third graph shows the annual sales and year end inventory since 1982 (sales since 1969), normalized by the number of owner occupied units. This graph shows that inventory is at an all time record level by this key measure.
This also shows the annual variability in the turnover of existing homes, with a median of 6% of owner occupied units selling per year. Currently 6% of owner occupied units would be about 4.6 million existing home sales per year. This indicates that the turnover of existing homes - March sales were at a 4.93 million Seasonally Adjusted Annual Rate (SAAR) - is still above the historical median.
This suggests that sales of existing homes could fall significantly more in 2008.
Thursday, April 24, 2008
More on March New Home Sales
by Calculated Risk on 4/24/2008 10:24:00 AM
For more graphs, see March New Home Sales, Lowest since 1991. Click on graph for larger image.
This graph shows New Home Sales vs. recessions for the last 45 years. New Home sales were falling prior to every recession, with the exception of the business investment led recession of 2001.
It appears the U.S. economy is now in recession - possibly starting in December - as shown on graph.
New home sales in March were the lowest since 1991. This is what we call Cliff Diving!
The second graph shows monthly new home sales (NSA - Not Seasonally Adjusted).
Notice the Red columns for 2008. This is the lowest sales for March since the recession of '91.
As the graph indicates, the spring selling season has never really started.
And one more long term graph - this one for New Home Months of Supply.
"Months of supply" is at 11 months; the highest level since 1981. Note that this doesn't include cancellations, but that was true for the earlier periods too.
The all time high for Months of Supply was 11.6 months in April 1980.
Once again, the current recession is "probable" and hasn't been declared by NBER.
March New Home Sales, Lowest since 1991
by Calculated Risk on 4/24/2008 10:01:00 AM
According to the Census Bureau report, New Home Sales in March were at a seasonally adjusted annual rate of 526 thousand. Sales for February were revised down to 575 thousand.  Click on Graph for larger image.
Sales of new one-family houses in March 2008 were at a seasonally adjusted annual rate of 526,000 ... This is 8.5 percent below the revised February rate of 575,000 and is 36.6 percent below the March 2007 estimate of 830,000. 
The seasonally adjusted estimate of new houses for sale at the end of March was 468,000.
Inventory numbers from the Census Bureau do not include cancellations - and cancellations are near record levels. Actual New Home inventories are probably much higher than reported - my estimate is about 100K higher.
Still, the 468,000 units of inventory is below the levels of the last year, and it appears that even including cancellations, inventory is now falling. 
This represents a supply of 11.0 months at the current sales rate.
This is reverse cliff diving!
This is another very weak report for New Home sales, and I'll have some analysis later today.
Sunday, April 20, 2008
Minnesota's new ghost towns
by Calculated Risk on 4/20/2008 03:06:00 PM
From the Star Tribune, start with this 1+ minute audio slide show: Development dreams dashed (hat tip dryfly)
Here is the article: Minnesota's new ghost towns
The roots of that financial crisis can be found in places like Wright County, where the combination of affordable land, cheap money and boundless optimism lured builders and families chasing big homes in the kind of brand-new subdivisions they thought were beyond their reach.See-through homes. Kind of like the see-through office buildings in the '80s.
...
But the boom has unraveled as quickly as it began. While many established Wright County neighborhoods have avoided the worst of the housing market collapse, the county ranks as one of the state's worst areas hit by foreclosures. Pockets of this county, about 30 miles northwest of the Twin Cities, have seen home prices fall 30 percent or more in the past year.
And speaking of office buildings: I was driving along the 405 freeway in Orange County at sunset this week - the sun was shinning at the perfect angle through the buildings - and I was amazed at how many of the new office buildings have no tenants; See-through Buildings, The Sequel.
Wednesday, March 26, 2008
More on New Home Sales
by Calculated Risk on 3/26/2008 11:31:00 AM
There is actually some good news in the Census Bureau's New Home sales report this morning. But first a few more ugly graphs (see February New Home sales for earlier graphs). Click on graph for larger image.
This graph shows New Home Sales vs. recessions for the last 45 years. New Home sales were falling prior to every recession, with the exception of the business investment led recession of 2001.
It appears the U.S. economy is now in recession - possibly starting in December - as shown on graph.
This is what we call Cliff Diving!
The second graph shows monthly new home sales (NSA - Not Seasonally Adjusted).
Notice the Red columns in January and February 2008. This is the lowest sales for February since the recession of '91.
As the graph indicates, the spring selling season has started - and started poorly. Toll Brothers CEO said last month:
“The selling season, which we believe starts in mid-January, has been weak ..."And one more long term graph - this one for New Home Months of Supply.

"Months of supply" is at the highest level since 1981. Note that this doesn't include cancellations, but that was true for the earlier periods too.
The all time high for Months of Supply was 11.6 months in April 1980.
Once again, the current recession is "probable" and hasn't been declared by NBER.
So what is the good news?
There are actually two pieces of good news in the report. First, inventory levels (even accounting for cancellations) are clearly falling. This is a small first step in correcting the huge overhang in new home inventory.
Note: The inventory (and sales) reported by the Census Bureau doesn't account for cancellations, and the Census Bureau doesn't include many condos (especially high rise condos).
The second piece of good news is revisions. During periods of rapidly declining sales, the Census Bureau routinely overestimates sales in the initial report - and then revises down sales over the next few months. In this report, sales were revised up slightly for November (from 630K to 631K), December (605K to 611K) and January (588K to 601K). This is actually a positive sign that New Home sales might be nearing a bottom. However, a quick rebound in sales is unlikely with the huge overhang of both new and existing homes for sale.
February New Home Sales
by Calculated Risk on 3/26/2008 10:00:00 AM
According to the Census Bureau report, New Home Sales in February were at a seasonally adjusted annual rate of 590 thousand. Sales for January were revised up to 601 thousand.  Click on Graph for larger image.
Sales of new one-family houses in February 2008 were at a seasonally adjusted annual rate of 590,000 ... This is 1.8 percent below the revised January rate of 601,000 and is 29.8 percent below the February 2007 estimate of 840,000. 
The seasonally adjusted estimate of new houses for sale at the end of February was 471,000.
Inventory numbers from the Census Bureau do not include cancellations - and cancellations are once again at record levels. Actual New Home inventories are probably much higher than reported - my estimate is about 100K higher.
Still, the 471,000 units of inventory is below the levels of the last year, and it appears that even including cancellations, inventory is now falling. 
This represents a supply of 9.8 months at the current sales rate.
This is another weak report for New Home sales, and I'll have some analysis later today on New Home Sales.


