by Calculated Risk on 12/16/2009 08:30:00 AM
Wednesday, December 16, 2009
Housing Starts in November: Moving Sideways
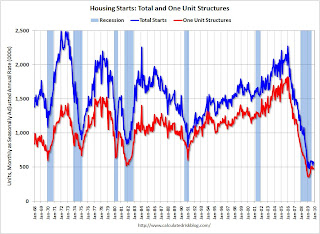 Click on graph for larger image in new window.
Total housing starts were at 574 thousand (SAAR) in November, up 8.9% from the revised October rate, and up from the all time record low in April of 479 thousand (the lowest level since the Census Bureau began tracking housing starts in 1959). Starts had rebounded to 590 thousand in June, and have moved mostly sideways for six months.
Single-family starts were at 482 thousand (SAAR) in November, up 2.1% from the revised October rate, and 35 percent above the record low in January and February (357 thousand). Just like for total starts, single-family starts have been at this level for six months.
Here is the Census Bureau report on housing Permits, Starts and Completions.
Housing Starts:This is both good news and bad news. The good news is the low level of starts means the excess housing inventory is being absorbed - a necessary step for housing (and the economy) to recover. The bad news is economic growth will probably be sluggish - and unemployment elevated - until residential investment picks up.
Privately-owned housing starts in November were at a seasonally adjusted annual rate of 574,000. This is 8.9 percent (±10.2%) above the revised October estimate of 527,000, but is 12.4 percent (±9.1%) below the November 2008 rate of 655,000.
Single-family housing starts in November were at a rate of 482,000; this is 2.1 percent (±9.2%) above the revised October figure of 472,000. The November rate for units in buildings with five units or more was 83,000.
Housing Completions:
Privately-owned housing completions in November were at a seasonally adjusted annual rate of 810,000. This is 8.7 percent (±13.7%)* above the revised October estimate of 745,000, but is 25.3 percent (±10.1%) below the November 2008 rate of 1,084,000.
Single-family housing completions in November were at a rate of 524,000; this is unchanged (±11.7%)* compared with the revised October figure. The November rate for units in buildings with five units or more was 270,000.
Wednesday, November 18, 2009
Quarterly Housing Starts and New Home Sales
by Calculated Risk on 11/18/2009 01:56:00 PM
The Census Bureau has released the "Quarterly Starts and Completions by Purpose and Design" report for Q3 2009.
Monthly housing starts (even single family starts) cannot be compared directly to new home sales, because the monthly housing starts report from the Census Bureau includes apartments, owner built units and condos that are not included in the new home sales report.
However it is possible to compare "Single Family Starts, Built for Sale" to New Home sales on a quarterly basis. The quarterly report shows that there were 93,000 single family starts, built for sale, in Q3 2009, and that is less than the 105,000 new homes sold for the same period. This data is Not Seasonally Adjusted (NSA). This suggests homebuilders are selling more homes than they are starting.
Note: new home sales are reported when contracts are signed, so it is appropriate to compare sales to starts (as opposed to completions). This is not perfect because homebuilders were stuck with “unintentional spec homes” during the housing bust because of the high cancellation rates, but cancellation rates are now much closer to normal. Click on graph for larger image in new window.
This graph provides a quarterly comparison of housing starts and new home sales. In 2005, and most of 2006, starts were higher than sales, and inventories of new homes rose sharply. For the two years starts have been below sales – and new home inventories have been falling.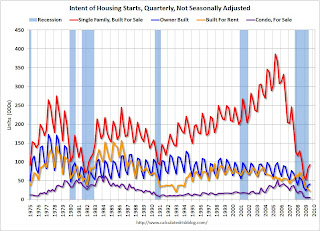 The second graph shows the NSA quarterly starts intent for four categories since 1975: single family built for sale, owner built (includes contractor built for owner), starts built for rent, and condos built for sale.
Condo starts in Q3 tied the all time record low for Condos built for sale set in Q1 and Q2 of this year (5,000); the previous record was 8,000 set in Q1 1991 (data started in 1975).
Owner built units are above the record low set in Q1 (42,000 units compared to 24,000 units in Q1 2009), however the pickup in owner built starts was probably mostly seasonal (this is NSA data).
Units built for rent were near the record low (23,000 units in Q3 2009 compared to the all time record low of 21,000 units). With the vacancy rate at a record high, the demand for new rental units will stay low for some time.
Housing Starts Decline Sharply in October
by Calculated Risk on 11/18/2009 08:30:00 AM
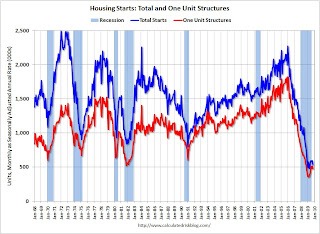 Click on graph for larger image in new window.
Total housing starts were at 529 thousand (SAAR) in October, down 10.6% from the revised September rate, and up from the all time record low in April of 479 thousand (the lowest level since the Census Bureau began tracking housing starts in 1959). Starts had rebounded to 590 thousand in June, and have move sideways (or down) for five months.
Single-family starts were at 476 thousand (SAAR) in October, down 6.8% from the revised September rate, and 33 percent above the record low in January and February (357 thousand). Just like for total starts, single-family starts have been at this level for five months.
The following graph shows total housing starts and the percent vacant housing units (owner and rental) in the U.S. Note: this is a combined vacancy rate based on the Census Bureau vacancy rates for owner occupied and rental housing. It is very unlikely that there will be a strong rebound in housing starts with a record number of vacant housing units.
The vacancy rate has continued to climb even after housing starts fell off a cliff. Initially this was because of a significant number of completions. Also some hidden inventory (like some 2nd homes) have become available for sale or for rent, and lately some households have probably doubled up because of tough economic times.
Here is the Census Bureau report on housing Permits, Starts and Completions.
Housing Starts:It appears that single family starts bottomed in January. However, as expected, it appears starts are now moving sideways - and will probably stay near this level until the excess existing home inventory is reduced.
Privately-owned housing starts in October were at a seasonally adjusted annual rate of 529,000. This is 10.6 percent (±8.7%) below the revised September estimate of 592,000 and is 30.7 percent (±8.3%) below the October 2008 rate of 763,000.
Single-family housing starts in October were at a rate of 476,000; this is 6.8 percent (±7.5%)* below the revised September figure of 511,000.
Housing Completions:
Privately-owned housing completions in October were at a seasonally adjusted annual rate of 740,000. This is 1.9 percent (±12.4%)* above the revised September estimate of 726,000, but is 29.9 percent (±9.7%) below the October 2008 rate of 1,055,000.
Single-family housing completions in October were at a rate of 528,000; this is 10.7 percent (±14.5%)* above the revised September figure of 477,000.
Sunday, November 15, 2009
Housing Starts and Vacant Units: No "V" Shaped Recovery
by Calculated Risk on 11/15/2009 07:31:00 PM
On Friday I posted a graph showing the historical relationship between housing starts and the unemployment rate (repeated as the 2nd graph below). The graph shows that housing leads the economy both into and out of recessions, and the unemployment rate lags housing by about 12 to 18 months.
It appears that housing starts bottomed earlier this year, however I don't think we will see a sharp recovery in housing this time - and I also think unemployment will remain high throughout 2010. As I noted in the earlier post, there is still a large overhang of vacant housing in the United States, and a sharp bounce back in housing starts is unlikely.
The following graph shows total housing starts and the percent vacant housing units (owner and rental) in the U.S. Note: this is a combined vacancy rate based on the Census Bureau vacancy rates for owner occupied and rental housing. Click on graph for larger image in new window.
It is very unlikely that there will be a strong rebound in housing starts with a record number of vacant housing units.
The vacancy rate has continued to climb even after housing starts fell off a cliff. Initially this was because of a significant number of completions. Also some hidden inventory (like some 2nd homes) have become available for sale or for rent, and lately some households have probably doubled up because of tough economic times.
Note: the increase in the vacancy rate in the '80s was due to several factors including demographics (baby boomers moving from renting to owning), and overbuilding of apartment units (part of S&L crisis).
Here is a repeat of the earlier graph: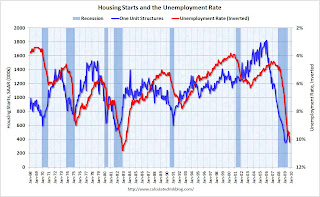 This graph shows single family housing starts and unemployment (inverted). (The first graph shows total housing starts)
You can see both the correlation and the lag. The lag is usually about 12 to 18 months, with peak correlation at a lag of 16 months for single unit starts. The 2001 recession was a business investment led recession, and the pattern didn't hold.
This suggests unemployment might peak in Spring or Summer 2010. However, since I expect the housing recovery to be sluggish, I also expect unemployment to remain high throughout 2010.
Friday, November 13, 2009
Housing Starts and the Unemployment Rate
by Calculated Risk on 11/13/2009 12:54:00 PM
This is an update to an earlier post. As I've noted for some time, housing leads the economy and is the best leading indicator for the economy - both into and out of recessions.
Update: Employment tends to be a coincident indicator into recessions, and used to be coincident coming out of recessions. Employment has lagged the economy after the previous two recessions (and appears to be lagging again).
Employment lags housing, and the following graph shows the relationship between starts and unemployment.
The graph is based on a talk by Jon Fisher, a professor at the University of San Francisco School of Business.  Click on graph for larger image in new window.
This graph shows housing starts (both total and single unit) and unemployment (inverted).
You can see both the correlation and the lag. The lag is usually about 12 to 18 months, with peak correlation at a lag of 16 months for single unit starts. The 2001 recession was a business investment led recession, and the pattern didn't hold.
This suggests unemployment might peak in Spring 2010.
Professor Fisher argued that unemployment will rise to about 10.4% and then fall rapidly. He is now projecting unemployment will decline to 8% by the end of 2010.
He is basing the rapid decline in unemployment on a "V shaped" housing recovery similar to previous recessions. I disagree with that point.
In most earlier recessions, the slumps were caused by the Fed raising interest rates to fight inflation. When the Fed cut rates, housing bounced back sharply (V shaped).
Although this recession was led by a housing bust - and that makes it look similar to some previous periods - this recession was not engineered by the Fed raising rates, rather it was the busting of the credit and housing bubbles, and all the related problems that led the economy into recession. Since there is still far too much existing home inventory, a sharp bounce back in housing starts is unlikely, so I think Fisher's forecast for a rapid decline in unemployment is also unlikely.
Tuesday, October 20, 2009
Housing Starts in September: Moving Sideways
by Calculated Risk on 10/20/2009 08:30:00 AM
 Click on graph for larger image in new window.
Total housing starts were at 590 thousand (SAAR) in September, up 0.5% from the revised August rate, and up sharply from the all time record low in April of 479 thousand (the lowest level since the Census Bureau began tracking housing starts in 1959). Starts had rebounded to 590 thousand in June, and have move sideways for four months.
Single-family starts were at 501 thousand (SAAR) in September, up 3.9% from the revised August rate, and 40 percent above the record low in January and February (357 thousand). Just like for total starts, single-family starts have been at this level for four months.
Here is the Census Bureau report on housing Permits, Starts and Completions.
Building Permits:Note that single-family completions of 464 thousand are below the level of single-family starts (501 thousand). This suggests residential construction employment maybe be near a bottom.
Privately-owned housing units authorized by building permits in September were at a seasonally adjusted annual rate of 573,000. This is 1.2 percent (±1.8%)* below the revised August rate of 580,000 and is 28.9 percent (±2.2%) below the September 2008 estimate of 806,000.
Single-family authorizations in September were at a rate of 450,000; this is 3.0 percent (±1.0%) below the revised August figure of 464,000.
Housing Starts:
Privately-owned housing starts in September were at a seasonally adjusted annual rate of 590,000. This is 0.5 percent (±9.9%)* above the revised August estimate of 587,000, but is 28.2 percent (±6.7%) below the September 2008 rate of 822,000.
Single-family housing starts in September were at a rate of 501,000; this is 3.9 percent (±9.3%)* above the revised August figure of 482,000.
Housing Completions:
Privately-owned housing completions in September were at a seasonally adjusted annual rate of 693,000. This is 10.2 percent (±10.4%)* below the revised August estimate of 772,000 and is 39.6 percent (±5.7%) below the September 2008 rate of 1,148,000.
Single-family housing completions in September were at a rate of 464,000; this is 8.3 percent (±14.3%)* below the revised August figure of 506,000.
It appears that single family starts bottomed in January. However, as expected, it appears starts are now moving sideways - and will probably stay near this level until the excess existing home inventory is reduced.
Thursday, September 17, 2009
Housing Starts in August: Moving Sideways
by Calculated Risk on 9/17/2009 08:31:00 AM
 Click on graph for larger image in new window.
Total housing starts were at 598 thousand (SAAR) in August, up 1.5% from the revised July rate, and up sharply from the all time record low in April of 479 thousand (the lowest level since the Census Bureau began tracking housing starts in 1959).
Single-family starts were at 479 thousand (SAAR) in August, down 3.0% from the revised July rate, but still 34 percent above the record low in January and February (357 thousand).
Permits for single-family units were 462 thousand in August, suggesting single-family starts will be steady in September.
Here is the Census Bureau report on housing Permits, Starts and Completions.
Building Permits:Note that single-family completions of 489 thousand are at about the same level as single-family starts (479 thousand). This suggests residential construction employment has stabilized.
Privately-owned housing units authorized by building permits in August were at a seasonally adjusted annual rate of 579,000. This is 2.7 percent (±1.2%) above the revised July rate of 564,000, but is 32.4 percent (±1.3%) below the August 2008 estimate of 857,000.
Single-family authorizations in August were at a rate of 462,000; this is 0.2 percent (±1.1%) below the revised July figure of 463,000.
Housing Starts:
Privately-owned housing starts in August were at a seasonally adjusted annual rate of 598,000. This is 1.5 percent (±7.9%) above the revised July estimate of 589,000, but is 29.6 percent (±6.0%) below the August 2008 rate of 849,000.
Single-family housing starts in August were at a rate of 479,000; this is 3.0 percent (±5.7%) below the revised July figure of 494,000.
Housing Completions:
Privately-owned housing completions in August were at a seasonally adjusted annual rate of 760,000. This is 5.5 percent (±14.0%) below the revised July estimate of 804,000 and is 25.3 percent (±9.6%) below the August 2008 rate of 1,018,000.
Single-family housing completions in August were at a rate of 489,000; this is 1.6 percent (±12.7%)* below the revised July figure of 497,000.
It now appears that single family starts bottomed in January. However, as expected, it appears starts are moving sideways - and will probably stay near this level until the excess existing home inventory is reduced.
Saturday, September 05, 2009
Housing Starts and the Unemployment Rate
by Calculated Risk on 9/05/2009 01:49:00 PM
Here is an update. See the post last month for much more discussion ... Click on graph for larger image in new window.
This graph shows housing starts (both total and single unit) and unemployment (inverted).
You can see both the correlaton and the lag. The lag is usually about 12 to 18 months, with peak correlation at a lag of 16 months for single unit starts. The 2001 recession was a business investment led recession, and the pattern didn't hold.
This suggests unemployment might peak in Spring 2010.
Saturday, August 29, 2009
Quarterly Housing Starts and New Home Sales
by Calculated Risk on 8/29/2009 01:02:00 PM
The Census Bureau has released the "Quarterly Starts and Completions by Purpose and Design" report for Q2 2009 a few days ago.
Monthly housing starts (even single family starts) cannot be compared directly to new home sales, because the monthly housing starts report from the Census Bureau includes apartments, owner built units and condos that are not included in the new home sales report.
However it is possible to compare "Single Family Starts, Built for Sale" to New Home sales on a quarterly basis. The quarterly report shows that there were 82,000 single family starts, built for sale, in Q2 2009 and that is less than the 102,000 new homes sold for the same period. This data is Not Seasonally Adjusted (NSA). This suggests homebuilders are selling more homes than they are starting.
Note: new home sales are reported when contracts are signed, so it is appropriate to compare sales to starts (as opposed to completions). This is not perfect because homebuilders were stuck with “unintentional spec homes” during the housing bust because of the high cancellation rates, but cancellation rates are now much closer to normal. Click on graph for larger image in new window.
This graph provides a quarterly comparison of housing starts and new home sales. In 2005, and most of 2006, starts were higher than sales, and inventories of new homes rose sharply. For the last seven quarters, starts have been below sales – and new home inventories have been falling. The second graph shows the NSA quarterly starts intent for four categories since 1975: single family built for sale, owner built (includes contractor built for owner), starts built for rent, and condos built for sale.
Condo starts in Q2 tied the all time record low for Condos built for sale set in Q1 (5,000); the previous record was 8,000 set in Q1 1991 (data started in 1975).
Owner built units are above the record low set last quarter (38,000 units compared to 24,000 units in Q1 2009), however the pickup in starts was probably mostly seasonal (this is NSA data).
And single family units built for sale were also above the record low set last quarter (82,000 compared to 53,000 in Q1 2009).
Tuesday, August 18, 2009
Comparing Housing Start Recoveries
by Calculated Risk on 8/18/2009 10:00:00 AM
It appears that single-family housing starts bottomed in January of this year. Single-family starts in July were 37 percent above the January low - based on the seasonally adjusted annual rate (SAAR).
How does this compare to previous housing recoveries?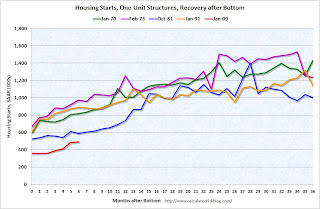 Click on graph for larger image in new window.
The first graph compares the current recovery with four previous housing recoveries. The recoveries are labeled with the month that single-family housing starts bottomed.
Starts fell to record lows in the current housing bust (adjusted for changes in population, or number of households, would make the current bust even worse).
Usually housing starts increase steadily for the first two years following a housing bottom. The second graph shows the same data, normalized by setting the bottom for single-family housing starts to 100.
This graph shows that housing starts usually double in the two years following the bottom. Starts increased 80 percent over two years in the recovery following the Jan 1991 bottom, and 136 percent in the recovery following the Jan 1970 bottom.
If starts doubled over the two years following the Jan 2009 bottom, single-family starts would recover to 715 thousand by Jan 2011. And looking at the first graph some people might think single-family starts might recover to a 1.1 million rate within 2 years. That seems very unlikely.
I started this year looking for the bottom in single family housing starts (and I think the bottom is in), but I expect the recovery to be sluggish because of all the excess housing units, and also because of the ongoing decline in the homeownership rate. I'll have more on this later - but hopefully these graphs show what many people expect.
Housing Starts Flat in July
by Calculated Risk on 8/18/2009 08:30:00 AM
 Click on graph for larger image in new window.
Total housing starts were at 581 thousand (SAAR) in July, off slightly from June, but up sharply over the last three months from the all time record low in April of 479 thousand (the lowest level since the Census Bureau began tracking housing starts in 1959).
Single-family starts were at 490 thousand (SAAR) in July, up slightly from June; 37 percent above the record low in January and February (357 thousand).
Permits for single-family units were 458 thousand in July, suggesting single-family starts might decline slightly in August.
Here is the Census Bureau report on housing Permits, Starts and Completions.
Building Permits:Note that single-family completions of 491 thousand are at the same level as single-family starts (490 thousand).
Privately-owned housing units authorized by building permits in July were at a seasonally adjusted annual rate of 560,000. This is 1.8 percent (±1.4%) below the revised June rate of 570,000 and is 39.4 percent (±1.8%) below the July 2008 estimate of 924,000.
Single-family authorizations in July were at a rate of 458,000; this is 5.8 percent (±1.1%) above the revised June figure of 433,000.
Housing Starts:
Privately-owned housing starts in July were at a seasonally adjusted annual rate of 581,000. This is 1.0 percent (±8.5%)* below the revised June estimate of 587,000 and is 37.7 percent (±5.1%) below the July 2008 rate of 933,000.
Single-family housing starts in July were at a rate of 490,000; this is 1.7 percent (±7.1%)* above the revised June figure of 482,000.
Housing Completions:
Privately-owned housing completions in July were at a seasonally adjusted annual rate of 802,000. This is 0.9 percent (±10.1%)* below the revised June estimate of 809,000 and is 26.4 percent (±6.9%) below the July 2008 rate of 1,089,000.
Single-family housing completions in July were at a rate of 491,000; this is 4.1 percent (±8.9%)* below the revised June figure of 512,000.
It now appears that single family starts bottomed in January. However I expect starts to remain at fairly low levels for some time as the excess inventory is worked off.
Saturday, August 08, 2009
Housing Starts and the Unemployment Rate
by Calculated Risk on 8/08/2009 11:22:00 PM
Reader Mark sent me a link to a talk by Jon Fisher, a professor at the University of San Francisco School of Business. Jon made the point that housing starts and unemployment are inversely correlated.
Of course readers here know that housing lead the economy, and employment lags. So naturally housing and unemployment are inversely correlated with a lag.
Note: Dr. Leamer's Sept 2007 paper: Housing is the Business Cycle is an excellent overview of how housing leads the economy. (Something I covered extensively in 2005) Click on graph for larger image in new window.
This graph shows housing starts (both total and single unit) and unemployment (inverted).
You can see both the correlaton and the lag. The lag is usually about 12 to 18 months, with peak correlation at a lag of 16 months for single unit starts. The 2001 recession was a business investment led recession, and the pattern didn't hold.
This suggests unemployment might peak in Spring 2010.
Professor Fisher argued that unemployment will rise to about 10.4% and then fall rapidly. He is basing the rapid decline on a "V shaped" housing recovery similar to previous recessions. I disagree with that point.
In most earlier recessions, the slumps were caused by the Fed raising interest rates to fight inflation. When the Fed cut rates, housing bounced back sharply (V shaped).
Although this recession was led by a housing bust - and that makes it look similar to some previous periods - this recession was not engineered by the Fed raising rates, rather it was the busting of the credit and housing bubbles, and all the related problems that led the economy into recession. Since there is still far too much existing home inventory, a sharp bounce back in housing starts is unlikely, so I think Fisher's forecast for a rapid decline in unemployment is also unlikely.
Saturday, July 18, 2009
Housing Starts: A Little Bit of Good News
by Calculated Risk on 7/18/2009 05:29:00 PM
For the last few years, whenever housing starts increased, I wrote that was bad news because there was already too much inventory.
Now, even though there is still too much existing home inventory, and too much new home inventory in some areas, it appears that new home sales have stabilized. Since single family housing starts (built for sale) have been below new home sales for six consecutive quarters (through Q1), this suggests single family housing starts should also bottom soon. There is a good chance that has already happened.
Why is that good if there is still too much housing inventory overall?
This increase in starts means that the drag from Residential Investment will slow or stop, and also that residential construction employment is close to the bottom. Residential investment has been a drag on the economy for 14 straight quarters, and just removing that drag will seem like a positive.
And residential construction has lost jobs for several years, and even though construction employment will probably not increase significantly, not losing jobs will also seem like a positive.
This removes drags from the economy - and that is the little bit of good news.
To be clear, this is not great news for the homebuilders. It will take some time to work off all the excess inventory, so new home sales and single family housing starts will probably stay low for some time. And it is possible that new home sales and housing starts could still fall further.
Are new home sales actually below single family starts (built for sale)?
Monthly housing starts (single family starts) cannot be compared directly to new home sales, because the monthly housing starts report from the Census Bureau includes apartments, owner built units and condos that are not included in the new home sales report.
However it is possible to compare "Single Family Starts, Built for Sale", from the Census Bureau's "Quarterly Starts and Completions by Purpose and Design" to New Home sales on a quarterly basis.
The quarterly report shows that there were 52,000 single family starts, built for sale, in Q1 2009 and that is less than the 87,000 new homes sold for the same period. This data is Not Seasonally Adjusted (NSA). This suggests homebuilders are selling more homes than they are starting.
Note: new home sales are reported when contracts are signed, so it is appropriate to compare sales to starts (as opposed to completions), although this is not perfect because homebuilders have recently been stuck with “unintentional spec homes” because of the high cancellation rates. However cancellation rates for most homebuilders have fallen sharply recently. Click on graph for larger image in new window.
This graph provides a quarterly comparison of housing starts and new home sales. In 2005, and most of 2006, starts were higher than sales, and inventories of new homes rose sharply. For the last six quarters, starts have been below sales – and new home inventories have been falling.
What is Residential Investment?
Residential investment is a major investment category reported by the Bureau of Economic Analysis (BEA) as part of the GDP report.
Residential investment, according to the BEA, includes new single family structures, multifamily structures, home improvement, broker's commissions, and a few minor categories. This graph shows the various components of RI as a percent of GDP for the last 50 years. The most important components are investment in single family structures and home improvement.
Investment in home improvement was at a $162.3 billion Seasonally Adjusted Annual Rate (SAAR) in Q1, significantly above investment in single family structures of $113.7 billion (SAAR).
Let's take a closer look at investment in single family structures (usually the largest category): As everyone knows, investment in single family structures has fallen off a cliff. This is the component of RI that gets all the media attention - although usually from stories about single family starts and new home sales.
In Q1, investment in single family structures was at 0.8% of GDP, significantly below the average of the last 50 years of 2.35% - and also below the previous record low in 1982 of 1.20%.
Based on the housing starts report, investment in single family structures will probably increase in Q2 for the first time since Q1 2006. This doesn't guarantee that residential investment increased in Q2, because home improvement and the other categories might offset the gains in single family structure investment, but most of the drag on GDP should be gone.
Ritholtz: "Why are people calling a bottom for Real Estate?"
by Calculated Risk on 7/18/2009 03:19:00 PM
I'm working on a housing start post, but first ...
Barry Ritholtz presents the following graph and asks:
"I cannot figure out why people continue to call for a bottom in Real Estate — as if there is going to be this snap back any day now."
Well I'm one of the people who wrote yesterday that a bottom for single family housing starts might have happened:
It now appears that single family starts might have bottomed in January.A few quick points:
First, there will probably be two bottoms for Residential Real Estate. The first will be for new home sales, housing starts and residential investment. The second bottom will be for prices. For more on this, see: More on Housing Bottoms
Most people think prices when they hear the word "bottom", and the bottom for prices usually trails the bottom for housing starts - sometimes the two bottoms can happen years apart!
Second, looking for a bottom in housing starts doesn't imply "a snap back" in activity. As I noted yesterday, "I expect starts to remain at fairly low levels for some time as the excess inventory is worked off."
I'll have more on why the housing start report is somewhat good news soon.
Friday, July 17, 2009
Housing Starts increase in June from May
by Calculated Risk on 7/17/2009 08:30:00 AM
 Click on graph for larger image in new window.
Total housing starts were at 582 thousand (SAAR) in June, up sharply over the last two months from the all time record low in April of 479 thousand (the lowest level since the Census Bureau began tracking housing starts in 1959).
Single-family starts were at 470 thousand (SAAR) in June; 31 percent above the record low in January and February (357 thousand).
Permits for single-family units were 430 thousand in May, suggesting single-family starts might decline some in July.
Here is the Census Bureau report on housing Permits, Starts and Completions.
Building Permits:
Privately-owned housing units authorized by building permits in June were at a seasonally adjusted annual rate of 563,000. This is 8.7 percent (±3.0%) above the revised May rate of 518,000, but is 52.0 percent (±3.6%) below the June 2008 estimate of 1,174,000.
Single-family authorizations in June were at a rate of 430,000; this is 5.9 percent (±1.4%) above the revised May figure of 406,000. Authorizations of units in buildings with five units or more were at a rate of 109,000 in June.
Housing Starts:
Privately-owned housing starts in June were at a seasonally adjusted annual rate of 582,000. This is 3.6 percent (±11.3%)* above the revised May estimate of 562,000, but is 46.0 percent (±4.3%) below the June 2008 rate of 1,078,000.
Single-family housing starts in June were at a rate of 470,000; this is 14.4 percent (±11.8%) above the revised May figure of 411,000. The June rate for units in buildings with five units or more was 101,000.
Housing Completions:
Privately-owned housing completions in June were at a seasonally adjusted annual rate of 818,000. This is 0.4 percent (±15.7%)* below the revised May estimate of 821,000 and is 27.7 percent (±9.0%) below the June 2008 rate of 1,131,000.
Single-family housing completions in June were at a rate of 538,000; this is 8.9 percent (±14.7%)* above the revised May figure of 494,000. The June rate for units in buildings with five units or more was 271,000.
Note that single-family completions of 538 thousand are still significantly higher than single-family starts (401 thousand).
It now appears that single family starts might have bottomed in January. However I expect starts to remain at fairly low levels for some time as the excess inventory is worked off.
Tuesday, June 16, 2009
Housing Starts May
by Calculated Risk on 6/16/2009 08:30:00 AM
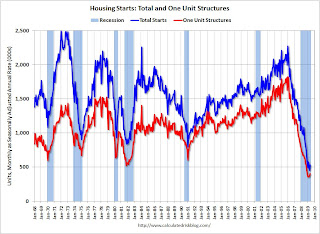 Click on graph for larger image in new window.
Total housing starts were at 532 thousand (SAAR) in May, rebounding from the all time record low in April of 454 thousand. The previous record low was 488 thousand in January (the lowest level since the Census Bureau began tracking housing starts in 1959).
Single-family starts were at 401 thousand (SAAR) in May; above the record low in January and February (357 thousand) and above 400 thousand for the first time since last November.
Permits for single-family units were 408 thousand in May, suggesting single-family starts will remain at about the same level in June.
Here is the Census Bureau report on housing Permits, Starts and Completions.
Building Permits:
Privately-owned housing units authorized by building permits in May were at a seasonally adjusted annual rate of 518,000. This is 4.0 percent (±1.7%) above the revised April rate of 498,000, but is 47.0 percent (±2.1%) below the May 2008estimate of 978,000.
Single-family authorizations in May were at a rate of 408,000; this is 7.9 percent (±1.5%) above the revised April figure of 378,000.
Housing Starts:
Privately-owned housing starts in May were at a seasonally adjusted annual rate of 532,000. This is 17.2 percent (±14.4%) above the revised April estimate of 454,000, but is 45.2 percent (±5.8%) below the May 2008 rate of 971,000.
Single-family housing starts in May were at a rate of 401,000; this is 7.5 percent (±14.2%)* above the revised April figure of 373,000.
Housing Completions:
Privately-owned housing completions in May were at a seasonally adjusted annual rate of 811,000. This is 3.3 percent (±20.6%)* below the revised April estimate of 839,000 and is 28.8 percent (±11.1%) below the May 2008 rate of 1,139,000.
Single-family housing completions in May were at a rate of 491,000; this is 9.4 percent (±13.8%)* below the revised April figure of 542,000.
Note that single-family completions of 491 thousand are still significantly higher than single-family starts (401 thousand). This is important because residential construction employment tends to follow completions, and completions will probably decline further.
It is still too early to call the bottom for single family starts in January, however I do expect single family housing starts to bottom sometime in 2009.
Tuesday, May 19, 2009
Quarterly Housing Starts and New Home Sales
by Calculated Risk on 5/19/2009 10:58:00 AM
The Census Bureau has released the "Quarterly Starts and Completions by Purpose and Design" report for Q1 2009 today.
Monthly housing starts (even single family starts) cannot be compared directly to new home sales, because the monthly housing starts report from the Census Bureau includes apartments, owner built units and condos that are not included in the new home sales report.
However it is possible to compare "Single Family Starts, Built for Sale" to New Home sales on a quarterly basis. The quarterly report shows that there were 52,000 single family starts, built for sale, in Q1 2009 and that is less than the 87,000 new homes sold for the same period. This data is Not Seasonally Adjusted (NSA). This suggests homebuilders are selling more homes than they are starting.
Note: new home sales are reported when contracts are signed, so it is appropriate to compare sales to starts (as opposed to completions), although this is not perfect because homebuilders have recently been stuck with “unintentional spec homes” because of the high cancellation rates. Click on graph for larger image in new window.
This graph provides a quarterly comparison of housing starts and new home sales. In 2005, and most of 2006, starts were higher than sales, and inventories of new homes rose sharply. For the last six quarters, starts have been below sales – and new home inventories have been falling.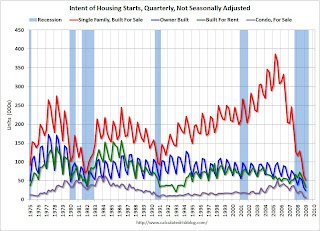 The second graph shows the NSA quarterly starts intent for four categories since 1975: single family built for sale, owner built (includes contractor built for owner), starts built for rent, and condos built for sale.
Condo starts have collapsed to almost zero (5,000 started in Q1 2009) and owner built units have fallen by about 75% from the peak. Units built for rent have held up the best, and they are still off about 60% from the highs of recent years.
Condo starts in Q1 were the all time record low for Condos built for sale (5,000), breaking the previous record of 8,000 set in Q1 1991 (data started in 1975). Owner built units set a new record low (24,000 units compared to 35,000 units in Q1 1982), and of course single family units built for sale set a record low (52,000 compared to 64,000 in Q4 2008 and 71,000 in Q4 1981).
Housing Starts at Record Low in April
by Calculated Risk on 5/19/2009 08:30:00 AM
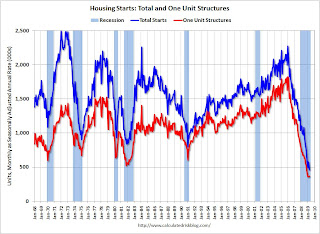 Click on graph for larger image in new window.
Total housing starts were at 458 thousand (SAAR) in April, the all time record low. The previous record low was 488 thousand in January (the lowest level since the Census Bureau began tracking housing starts in 1959).
Single-family starts were at 368 thousand (SAAR) in April; just above the revised record low in January (357 thousand).
Permits for single-family units were 373 thousand in April, suggesting single-family starts will remain at about the same level in May.
Here is the Census Bureau report on housing Permits, Starts and Completions.
Note that single-family completions of 549 thousand are still significantly higher than single-family starts (368 thousand). This is important because residential construction employment tends to follow completions, and completions will probably decline further.
It is still too early to call the bottom for single family starts in January, however I do expect housing starts to bottom sometime in 2009.
Thursday, April 16, 2009
Housing Starts: Near Record Low
by Calculated Risk on 4/16/2009 08:30:00 AM
 Click on graph for larger image in new window.
Total housing starts were at 510 thousand (SAAR) in March, just above the revised record low of 488 thousand in January (the lowest level since the Census Bureau began tracking housing starts in 1959).
Single-family starts were at 358 thousand in March; just above the revised record low in January (356 thousand).
Permits for single-family units were 361 thousand in March, suggesting single-family starts will remain at about the same level in April.
Here is the Census Bureau report on housing Permits, Starts and Completions.
Note that single-family completions of 550 thousand are still significantly higher than single-family starts (358 thousand). This is important because residential construction employment tends to follow completions, and completions will probably decline further.
Total starts and single family starts declined in March (compared to February), and are both just above the record low set in January. This is the second month in a row with starts slightly above the record low - this is just a slight increase in total starts and single family starts are essentially flat with the record low.
It is still too early to call the bottom in January, however I do expect housing starts to bottom sometime in 2009.
Wednesday, March 18, 2009
More on Housing Bottoms
by Calculated Risk on 3/18/2009 03:23:00 PM
Yesterday I noted that housing starts might be nearing a bottom. This post led to a number of emails from readers stating that they believe prices will fall further. I agree.
There will almost certainly be two distinct bottoms for housing: the first will be single-family housing starts, new home sales, and residential investment, and the second will be for house prices.
These bottoms could happen years apart!
As I noted yesterday, it is way too early to try to call the bottom in prices. House prices will almost certainly fall for some time. My original prediction (a few years ago) was that real house prices would fall for 5 to 7 years, and we could start looking for a bottom in the 2010 to 2012 time frame for the bubble areas. That still seems reasonable to me. However some lower priced areas might be much closer to the bottom.
For the first bottom, we have several possible measure - the following graph shows three of the most commonly used: Starts, New Home Sales, and Residential Investment (RI) as a percent of GDP. Click on graph for larger image in new window.
The arrows point to some of the earlier peaks and troughs for these three measures.
The purpose of this graph is to show that these three indicators generally reach peaks and troughs together. Note that Residential Investment is quarterly and single-family starts and new home sales are monthly.
We could use any of these three measures to determine the first bottom, and then use the other two to confirm the bottom. But this says nothing about prices.  The second graph compares RI as a percent of GDP with the real Case-Shiller National house price index.
Although the Case-Shiller data only goes back to 1987, look at what happened following the early '90s housing bust. RI as a percent of GDP bottomed in Q1 1991, but real house prices didn't bottom until Q4 1996 - more than 5 years later!
Something similar will most likely happen again. Indicators like new home sales, housing starts and residential investment will bottom long before house prices.
Economists and analysts care about these housing indicators (starts, sales, RI) because they impact GDP and employment. However most people (homeowners, potential homebuyers) think 'house prices' when we talk about a housing bottom - so we have to be aware that there will be two different housing bottoms. And a bottom in starts doesn't imply a bottom in prices.


