 RSS Feed
 by Calculated Risk on 6/30/2025 08:16:00 PM
Monday, June 30, 2025
Tuesday: Fed Chair Powell, ISM Mfg, Construction Spending, Job Openings, Vehicle Sales
 From Matthew Graham at Mortgage News Daily: Mortgage Rates Take Another Step Toward April Lows
April 3rd and 4th saw the average top tier 30yr fixed mortgage rates well into the "mid 6's." Many lenders were able to quote 6.5% at the time. Just a few days ago, we noted there was still a ways to go before breaking below those early April levels, but the past few days have taken us within striking distance. [30 year fixed 6.67%]Tuesday:
emphasis added
• At 9:30 AM ET, Discussion, Fed Chair Jerome Powell, Policy Panel Discussion, At the European Central Bank Forum on Central Banking 2025, Sintra, Portugal
• At 10:00 AM, ISM Manufacturing Index for June. The consensus is for the ISM to be at 48.8, up from 48.5 in May.
• At 10:00 AM, Construction Spending for May. The consensus is for a 0.1% decrease in construction spending.
• At 10:00 AM, Job Openings and Labor Turnover Survey for May from the BLS.
• Late in the day, Light vehicle sales for June. The consensus is for light vehicle sales to be 15.5 million SAAR in June, down from 15.6 million in May (Seasonally Adjusted Annual Rate).
Trump and Fed Policy
by Calculated Risk on 6/30/2025 04:20:00 PM
Today President Trump put out a note urging Fed Chair Powell to lower rates.
The following image, courtesy of Conor Sen, shows the central bank rates around the world. Mr. Trump wrote:
Jerome, You are, as usual, "Too Late". You have cost the USA a fortune - and continue to do so - you should lower the rate - by a lot! Hundreds of billions of dollars being lost! No Inflation.
Mr. Trump also wrote "Should be here" and referenced rates between 0.25% and 1.75%. The current Fed's Fund rate is between 4.25% and 4.5%. Fed Chair Powell is probably correct about rates currently being "modestly" restrictive, but it is possible we are neutral now.
First, there is some inflation. The current rate of core PCE inflation was at 2.7% year-over-year in May, up from 2.5% in April. Core PCE inflation has slowed to 1.7% annualized over the last 3 months. Add in a 1.75% real rate - and you get close to the current Fed Funds rate.
It is difficult to predict what will happen over the next year. There is considerable uncertainty about the impact of policy on inflation and the economy in coming months.
 Click on graph for larger image.
Goldman Sachs economists noted today:
"We are pulling forward our forecast for the next cut to September. We had previously expected a cut in December because we thought that the peak summer tariff effects on monthly inflation would make it awkward to cut sooner. But the very early evidence suggests that the tariff effects look a bit smaller than we expected, other disinflationary forces have been stronger, and we suspect that the Fed leadership shares our view that tariffs will only have a one-time price level effect. And while the labor market still looks healthy, it has become hard to find a job, and both residual seasonality and immigration policy changes pose near-term downside risk to payrolls."Maybe the impact on inflation from the tariffs will be less than expected. And it seems likely the impact will be mostly transitory.
It is also possible the economic weakness from policy (immigration, fiscal) will more than offset any boost to inflation from the tariffs. Although immigration policy might push up inflation for food, etc. It is very uncertain right now.
It appears that currently Fed Funds policy is reasonably appropriate.
Freddie Mac House Price Index Declined in May; Up 2.2% Year-over-year
by Calculated Risk on 6/30/2025 01:16:00 PM
Today, in the Calculated Risk Real Estate Newsletter: Freddie Mac House Price Index Declined in May; Up 2.2% Year-over-year
A brief excerpt:
Freddie Mac reported that its “National” Home Price Index (FMHPI) decreased -0.23% month-over-month (MoM) on a seasonally adjusted (SA) basis in May. On a year-over-year (YoY) basis, the National FMHPI was up 2.2% in May, down from up 2.6% YoY in April. The YoY increase peaked at 19.0% in July 2021, and for this cycle, bottomed at up 0.9% YoY in April 2023. ...There is much more in the article!
As of May, 31 states and D.C. were below their previous peaks, Seasonally Adjusted. The largest seasonally adjusted declines from the recent peaks are in D.C. (-4.7), Colorado (-3.1%), Idaho (-3.0%), Texas (-2.7%), and Florida (-2.2%).
For cities (Core-based Statistical Areas, CBSA), 257 of the 384 CBSAs are below their previous peaks.
Here are the 30 cities with the largest declines from the peak, seasonally adjusted. Austin continues to be the worst performing city. However, 4 of the 6 cities with the largest price declines are in Florida. Cities in Florida (10) and Texas (7) dominate this list.

FHFA’s National Mortgage Database: Outstanding Mortgage Rates, LTV and Credit Scores
by Calculated Risk on 6/30/2025 09:51:00 AM
Today, in the Calculated Risk Real Estate Newsletter: FHFA’s National Mortgage Database: Outstanding Mortgage Rates, LTV and Credit Scores
A brief excerpt:
Here are some graphs on outstanding mortgages by interest rate, the average mortgage interest rate, borrowers’ credit scores and current loan-to-value (LTV) from the FHFA’s National Mortgage Database through Q1 2025 (released last Friday).There is much more in the article.
...
This shows the surge in the percent of loans under 3% starting in early 2020 as mortgage rates declined sharply during the pandemic.
Note that a fairly large percentage of mortgage loans were under 4% prior to the pandemic!
The percent of outstanding loans under 4% peaked in Q1 2022 at 65.1% (now at 53.4%), and the percent under 5% peaked at 85.6% (now at 71.3%). These low existing mortgage rates made it difficult for homeowners to sell their homes and buy a new home since their monthly payments would increase sharply.
This was a key reason existing home inventory levels were so low. However, time is eroding this lock-in effect.

Housing June 30th Weekly Update: Inventory up 0.3% Week-over-week, Up 28.7% Year-over-year
by Calculated Risk on 6/30/2025 08:11:00 AM
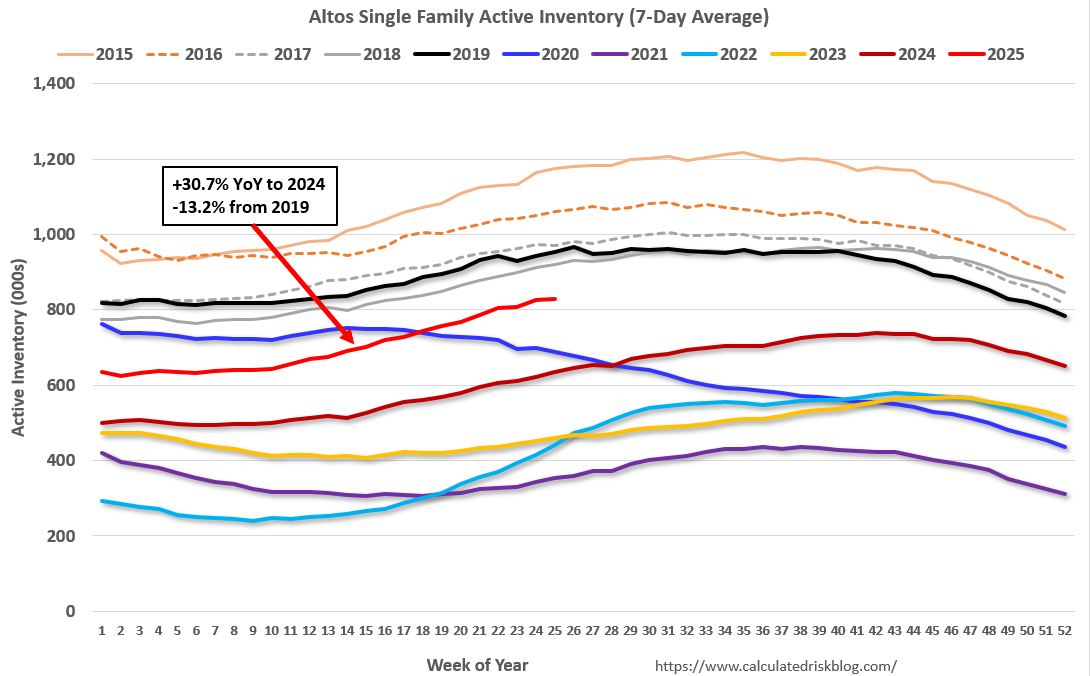
Altos reports that active single-family inventory was up 0.3% week-over-week.
Inventory is now up 33.1% from the seasonal bottom in January and is increasing. Usually, inventory is up about 20% from the seasonal low by this week in the year. So, 2025 is seeing a larger than normal pickup in inventory.
The first graph shows the seasonal pattern for active single-family inventory since 2015.
 Click on graph for larger image.
The red line is for 2025. The black line is for 2019.
Inventory was up 28.7% compared to the same week in 2024 (last week it was up 30.7%), and down 14.1% compared to the same week in 2019 (last week it was down 13.2%).
This is the highest level since November 2019.
For 2019, this was the week inventory peaked for the year (then moved sideways for several months), so any further increase this year will close to gap to 2019. It now appears inventory will be close to 2019 levels towards the end of 2025.
 This second inventory graph is courtesy of Altos Research.
As of June 27th, inventory was at 831 thousand (7-day average), compared to 829 thousand the prior week.
Mike Simonsen discusses this data regularly on Youtube
Sunday, June 29, 2025
Sunday Night Futures
by Calculated Risk on 6/29/2025 07:08:00 PM
Weekend:
• Schedule for Week of June 29, 2025
Monday:
• At 9:45 AM ET, Chicago Purchasing Managers Index for June.
• At 10:30 AM, Dallas Fed Survey of Manufacturing Activity for June.
From CNBC: Pre-Market Data and Bloomberg futures S&P 500 are up 17 and DOW futures are up 212 (fair value).
Oil prices were down over the last week with WTI futures at $65.52 per barrel and Brent at $67.77 per barrel. A year ago, WTI was at $83, and Brent was at $82 - so WTI oil prices are down about 21% year-over-year.
Here is a graph from Gasbuddy.com for nationwide gasoline prices. Nationally prices are at $3.17 per gallon. A year ago, prices were at $3.49 per gallon, so gasoline prices are down $0.32 year-over-year.
Hotels: Occupancy Rate Increased 1.3% Year-over-year
by Calculated Risk on 6/29/2025 08:11:00 AM
The U.S. hotel industry reported positive year-over-year comparisons, according to CoStar’s latest data through 21 June. ...The following graph shows the seasonal pattern for the hotel occupancy rate using the four-week average.
15-21 June 2025 (percentage change from comparable week in 2024):
• Occupancy: 70.5% (+1.3%)
• Average daily rate (ADR): US$163.77 (+2.0%)
• Revenue per available room (RevPAR): US$115.39 (+3.3%)
emphasis added
 Click on graph for larger image.
The red line is for 2025, blue is the median, and dashed light blue is for 2024. Dashed purple is for 2018, the record year for hotel occupancy.
The 4-week average of the occupancy rate is tracking behind both last year and the median rate for the period 2000 through 2024 (Blue).
Note: Y-axis doesn't start at zero to better show the seasonal change.
The 4-week average will increase during the summer travel season; however, we will likely see a hit to occupancy during the summer months due to less international tourism.
Saturday, June 28, 2025
Real Estate Newsletter Articles this Week: New Home Sales Decrease to 623,000 Annual Rate in May
by Calculated Risk on 6/28/2025 02:11:00 PM
At the Calculated Risk Real Estate Newsletter this week:
 Click on graph for larger image.
• New Home Sales Decrease to 623,000 Annual Rate in May
• NAR: Existing-Home Sales Increased to 4.03 million SAAR in May; Down 0.7% YoY
• Case-Shiller: National House Price Index Up 2.7% year-over-year in April
• Inflation Adjusted House Prices 1.7% Below 2022 Peak
• Final Look at Local Housing Markets in May and a Look Ahead to June Sales
This is usually published 4 to 6 times a week and provides more in-depth analysis of the housing market.
Schedule for Week of June 29, 2025
by Calculated Risk on 6/28/2025 08:11:00 AM
The key report scheduled for this week is the June employment report to be released on Thursday.
Other key reports include the June ISM Manufacturing survey, June Vehicle Sales and the Trade Deficit for May.
9:45 AM: Chicago Purchasing Managers Index for June.
10:30 AM: Dallas Fed Survey of Manufacturing Activity for June.
9:30 AM: Discussion, Fed Chair Jerome Powell, Policy Panel Discussion, At the European Central Bank Forum on Central Banking 2025, Sintra, Portugal
10:00 AM: ISM Manufacturing Index for June. The consensus is for the ISM to be at 48.8, up from 48.5 in May.
10:00 AM: Construction Spending for May. The consensus is for a 0.1% decrease in construction spending.
 10:00 AM ET: Job Openings and Labor Turnover Survey for May from the BLS.
 This graph shows job openings (black line), hires (dark blue), Layoff, Discharges and other (red column), and Quits (light blue column) from the JOLTS.
Jobs openings increased in April to 7.39 million from 7.20 million in March.
The number of job openings were down 3% year-over-year and quits were down 6% year-over-year.
 Late in the day: Light vehicle sales for June.
The consensus is for light vehicle sales to be 15.5 million SAAR in June, down from 15.6 million in May (Seasonally Adjusted Annual Rate).
This graph shows light vehicle sales since the BEA started keeping data in 1967. The dashed line is the sales rate for last month.
J.D. Power is forecasting sales of 15.0 million SAAR in June.
7:00 AM ET: The Mortgage Bankers Association (MBA) will release the results for the mortgage purchase applications index.
8:15 AM: The ADP Employment Report for June. This report is for private payrolls only (no government). The consensus is for 110,000 payroll jobs added in June, up from 37,000 in May.
 8:30 AM: Employment Report for June. The consensus is for 129,000 jobs added, and for the unemployment rate to be unchanged at 4.2%.
There were 139,000 jobs added in May, and the unemployment rate was at 4.2%.
This graph shows the jobs added per month since January 2021.
8:30 AM: The initial weekly unemployment claims report will be released. The consensus is for initial claims to increase to 239 thousand from 236 thousand last week.
 8:30 AM: Trade Balance report for May from the Census Bureau.
 This graph shows the U.S. trade deficit, with and without petroleum, through the most recent report. The blue line is the total deficit, and the black line is the petroleum deficit, and the red line is the trade deficit ex-petroleum products.
The consensus is the trade deficit to be $69.8 billion. The U.S. trade deficit was at $61.6 billion the previous month.
10:00 AM: the ISM Services Index for June. The consensus is for a reading of 50.8, up from 49.9.
All US markets will close early at 1:00 PM ET in observance of Independence Day
All US markets will be closed in observance of Independence Day
Friday, June 27, 2025
Las Vegas in May: Visitor Traffic Down 6.5% YoY; Convention Traffic up 10.7% YoY
by Calculated Risk on 6/27/2025 06:15:00 PM
From the Las Vegas Visitor Authority: May 2025 Las Vegas Visitor Statistics
With headwinds of ongoing economic uncertainty, the destination hosted approximately 3.4 million visitors in May, down ‐6.5% YoY.
Convention attendance reached approx. 511k for the month (up 10.7%), supported in part by show rotations including LightFair International (8,500 attendees), the Bitcoin conference (30k attendees) and the National Automatic Merchandising Association/NAMA Show (5k attendees). Also, a few shows were held in May this year vs. other months last year, including Las Vegas Antique Jewelry & Watch Show (7,500 attendees, held in June last year) and PETZONE360 Live (5k attendees, held in April last year.)
Hotel occupancy reached 83.0% for the month, down ‐3.1 pts with Weekend occupancy of 89.9% (down ‐3.5 pts) and Midweek occupancy of 79.3% (down ‐3.2 pts). ADR for the month reached $198 (‐2.2% YoY) with RevPAR of $165 (‐5.7% YoY).
emphasis added
 Click on graph for larger image.
 The first graph shows visitor traffic for 2019 (Black), 2020 (dark blue), 2021 (light blue), 2022 (light orange), 2023 (orange), 2024 (dark orange) and 2025 (red).
Visitor traffic was down 6.5% compared to last May. Visitor traffic was down 7.4% compared to May 2019.
Year-to-date (YTD) visitor traffic is down 6.1% compared to the same period in 2019.
 Convention traffic was up 10.7% compared to May 2024, but down 1.8% compared to May 2019.
The second graph shows convention traffic.

YTD convention traffic is down 5.7% compared to 2019.
Q2 GDP Tracking: Moving Down, Still Wide Range
by Calculated Risk on 6/27/2025 02:59:00 PM
There will be additional trade related distortions in Q2 boosting GDP.
From BofA:
Since our last weekly publication, our 2Q GDP tracking is down one-tenth to +2.5% q/q saar. [June 27th estimate]From Goldman:
emphasis added
We lowered our Q2 GDP tracking estimate by 0.1pp to +3.9% (quarter-over-quarter annualized). Our Q2 domestic final sales estimate stands at 0%. [June 27th estimate]And from the Atlanta Fed: GDPNow

The GDPNow model estimate for real GDP growth (seasonally adjusted annual rate) in the second quarter of 2025 is 2.9 percent on June 27, down from 3.4 percent on June 18. After recent releases from the US Census Bureau and the US Bureau of Economic Analysis, an increase in the nowcast of the contribution of net exports to second-quarter real GDP growth from 2.07 percentage points to 3.49 percentage points was more than offset by a decrease in the nowcasted GDP growth contribution of inventory investment from -0.42 percentage points to -2.22 percentage points. [June 27th estimate]
Final Look at Local Housing Markets in May and a Look Ahead to June Sales
by Calculated Risk on 6/27/2025 11:12:00 AM
Today, in the Calculated Risk Real Estate Newsletter: Final Look at Local Housing Markets in May and a Look Ahead to June Sales
A brief excerpt:
After the National Association of Realtors® (NAR) releases the monthly existing home sales report, I pick up additional local market data that is reported after the NAR. This is the final look at local markets in May.There is much more in the article.
There were several key stories for May:
• Sales NSA are down year-over-year (YoY) through May, and sales last year were the lowest since 1995! The YoY comparisons will be easier the next several months, so sales in 2025 might be close to the level in 2024.
• Sales SA were down YoY for the 4th consecutive month and 41 of the last 45 months.
• Months-of-supply is at the highest level since 2016 (tying one month near the start of the pandemic).
• The median price is barely up YoY, and with the increases in inventory, some regional areas will see more price declines.
Sales at 4.03 million on a Seasonally Adjusted Annual Rate (SAAR) basis were above the consensus estimate; however, housing economist Tom Lawler’s estimate was right on (usually very close).
Sales averaged close to 5.44 million SAAR for the month of May in the 2017-2019 period. So, sales are about 26% below pre-pandemic levels.
...
In May, sales in these markets were down 3.8% YoY. Last month, in April, these same markets were also down 3.8% YoY Not Seasonally Adjusted (NSA). The NAR reported sales in May were down 4.0% YoY NSA, so this sample is close.
Important: There were fewer working days in May 2025 (21) as in May 2024 (22). So, the year-over-year change in the headline SA data was higher than for the NSA data. According to the NAR, seasonally adjusted sales were only down 0.7% YoY in May.
...
More local data coming in July for activity in June!

PCE Measure of Shelter Decreases to 4.1% YoY in May
by Calculated Risk on 6/27/2025 08:55:00 AM
Here is a graph of the year-over-year change in shelter from the CPI report and housing from the PCE report this morning, both through May 2025.
 CPI Shelter was up 3.9% year-over-year in May, down from 4.0% in April, and down from the cycle peak of 8.2% in March 2023.
Housing (PCE) was up 4.1% YoY in May, down from 4.2% in April and down from the cycle peak of 8.3% in April 2023.
Since asking rents are mostly flat year-over-year, these measures will slowly continue to decline over the next year as rents for existing tenants continue to increase.
Since asking rents are mostly flat year-over-year, these measures will slowly continue to decline over the next year as rents for existing tenants continue to increase.
 The second graph shows PCE prices, Core PCE prices and Core ex-housing over the last 3 months (annualized):
Key measures are below the Fed's target on a 3-month basis.
3-month annualized change:
PCE Price Index: 1.1%
Core PCE Prices: 1.7%
Core minus Housing: 1.1%
Core PCE Prices: 1.7%
Core minus Housing: 1.1%
There appears to be some residual seasonality, especially in Q1.
Personal Income Decreased 0.4% in May; Spending Decreased 0.1%
by Calculated Risk on 6/27/2025 08:30:00 AM
From the BEA: Personal Income and Outlays, May 2025
Personal income decreased $109.6 billion (0.4 percent at a monthly rate) in May, according to estimates released today by the U.S. Bureau of Economic Analysis. Disposable personal income (DPI)—personal income less personal current taxes—decreased $125.0 billion (0.6 percent) and personal consumption expenditures (PCE) decreased $29.3 billion (0.1 percent).The May PCE price index increased 2.3 percent year-over-year (YoY), up from 2.1 percent YoY in April, and down from the recent peak of 7.2 percent in June 2022.
Personal outlays—the sum of PCE, personal interest payments, and personal current transfer payments—decreased $27.6 billion in May. Personal saving was $1.01 trillion in May and the personal saving rate—personal saving as a percentage of disposable personal income—was 4.5 percent.
From the preceding month, the PCE price index for May increased 0.1 percent. Excluding food and energy, the PCE price index increased 0.2 percent.
From the same month one year ago, the PCE price index for May increased 2.3 percent. Excluding food and energy, the PCE price index increased 2.7 percent from one year ago.
emphasis added
The PCE price index, excluding food and energy, increased 2.7 percent YoY, up from 2.5 percent in April, and down from the recent peak of 5.6 percent in February 2022.
The following graph shows real Personal Consumption Expenditures (PCE) through May 2025 (2017 dollars). Note that the y-axis doesn't start at zero to better show the change.
 Click on graph for larger image.
The dashed red lines are the quarterly levels for real PCE.
Personal income and PCE were below expectations.
Inflation was above expectations.
Using the two-month method to estimate Q2 real PCE growth, real PCE was increasing at a 2.4% annual rate in Q2 2024. (Using the mid-month method, real PCE was increasing at 2.0%). This suggests moderate PCE growth in Q2.
Thursday, June 26, 2025
Friday: Personal Income and Outlays, PCE Inflation
by Calculated Risk on 6/26/2025 07:59:00 PM
 Note: Mortgage rates are from MortgageNewsDaily.com and are for top tier scenarios.
Friday:
• At 8:30 AM ET: Personal Income and Outlays, May 2024. The consensus is for a 0.4% increase in personal income, and for a 0.3% increase in personal spending. And for the Core PCE price index to increase 0.1%. PCE prices are expected to be up 2.2% YoY, and core PCE prices up 2.5% YoY.
• At 10:00 AM: University of Michigan's Consumer sentiment index (Final for June).
• At 4:30 PM: Federal Reserve Board announces results from its annual bank stress test
Realtor.com Reports Most Active "For Sale" Inventory since December 2019
by Calculated Risk on 6/26/2025 03:29:00 PM
What this means: On a weekly basis, Realtor.com reports the year-over-year change in active inventory and new listings. On a monthly basis, they report total inventory. For May, Realtor.com reported inventory was up 31.5% YoY, but still down 14.4% compared to the 2017 to 2019 same month levels.
Here is their weekly report: Weekly Housing Trends: Latest Data as of June 21
• Active inventory climbed 27.5% year over year
The number of homes actively for sale remains on a strong upward trajectory, now 27.5% higher than this time last year. This represents the 85th consecutive week of annual gains in inventory. There were more than 1 million homes for sale again last week, marking the eighth week in a row over the threshold and the highest inventory level since December 2019.
• New listings—a measure of sellers putting homes up for sale—rose 3.5% year over year
New listings rose again last week on an annual basis, up 3.5% compared with the same period last year. ... This will be an important trend to watch, especially as regional real estate dynamics diverge and the market gradually shifts back in favor of buyers.
• The median list price was up 0.9% year over year
The median list price climbed again this week, but it’s still down 0.3% year to date. The median list price per square foot—which adjusts for changes in home size—rose 0.7% year over year. With inventory growing and 1 in 5 sellers slashing prices, the pendulum is swinging back toward a balanced market, as price growth slows and buyers gain more leverage.
Inflation Adjusted House Prices 1.7% Below 2022 Peak; Price-to-rent index is 8.8% below 2022 peak
by Calculated Risk on 6/26/2025 11:44:00 AM
Today, in the Calculated Risk Real Estate Newsletter: Inflation Adjusted House Prices 1.7% Below 2022 Peak
Excerpt:
It has been 19 years since the housing bubble peak, ancient history for many readers!There is much more in the article!
In the April Case-Shiller house price index released Tuesday, the seasonally adjusted National Index (SA), was reported as being 78% above the bubble peak in 2006. However, in real terms, the National index (SA) is about 11% above the bubble peak (and historically there has been an upward slope to real house prices). The composite 20, in real terms, is 2% above the bubble peak.
People usually graph nominal house prices, but it is also important to look at prices in real terms. As an example, if a house price was $300,000 in January 2010, the price would be $442,000 today adjusted for inflation (47% increase). That is why the second graph below is important - this shows "real" prices.
The third graph shows the price-to-rent ratio, and the fourth graph is the affordability index. The last graph shows the 5-year real return based on the Case-Shiller National Index.
...
The second graph shows the same two indexes in real terms (adjusted for inflation using CPI).
In real terms (using CPI), the National index is 1.7% below the recent peak, and the Composite 20 index is 1.8% below the recent peak in 2022.
Both the real National index and the Comp-20 index decreased in April.
It has now been 35 months since the real peak in house prices. Typically, after a sharp increase in prices, it takes a number of years for real prices to reach new highs (see House Prices: 7 Years in Purgatory)

NAR: Pending Home Sales Increase 1.8% in May; Up 1.1% YoY
by Calculated Risk on 6/26/2025 10:00:00 AM
From the NAR: NAR Pending Home Sales Report Reveals 1.8% Increase in May
Pending home sales increased by 1.8% in May from the prior month and 1.1% year-over-year, according to the National Association of REALTORS® Pending Home Sales report. All four U.S. regions experienced month-over-month increases – most notably the West. Year-over-year, contract signings rose in the Midwest and South, while they fell in the Northeast and West.Note: Contract signings usually lead sales by about 45 to 60 days, so this would usually be for closed sales in June and July.
Northeast
2.1% month-over-month increase.
0.5% year-over-year decrease.
Midwest
0.3% month-over-month increase.
2.6% year-over-year increase.
South
1.0% month-over-month increase.
2.0% year-over-year increase.
West
6.0% month-over-month increase.
1.2% year-over-year decrease.
emphasis added
Q1 GDP Growth Revised down to -0.5% Annual Rate
by Calculated Risk on 6/26/2025 08:38:00 AM
From the BEA: Gross Domestic Product, 1st Quarter 2025 (Third Estimate), GDP by Industry, and Corporate Profits (Revised)
Real gross domestic product (GDP) decreased at an annual rate of 0.5 percent in the first quarter of 2025 (January, February, and March), according to the third estimate released by the U.S. Bureau of Economic Analysis. In the fourth quarter of 2024, real GDP increased 2.4 percent..Here is a Comparison of Third and Second Estimates. PCE growth was revised down from 1.2% to 0.5%. Residential investment was revised down from -0.6% to -1.3%.
The decrease in real GDP in the first quarter primarily reflected an increase in imports, which are a subtraction in the calculation of GDP, and a decrease in government spending. These movements were partly offset by increases in investment and consumer spending.
Real GDP was revised down 0.3 percentage point from the second estimate, primarily reflecting downward revisions to consumer spending and exports that were partly offset by a downward revision to imports.
emphasis added
Weekly Initial Unemployment Claims Decrease to 236,000
by Calculated Risk on 6/26/2025 08:30:00 AM
The DOL reported:
In the week ending June 21, the advance figure for seasonally adjusted initial claims was 236,000, a decrease of 10,000 from the previous week's revised level. The previous week's level was revised up by 1,000 from 245,000 to 246,000. The 4-week moving average was 245,000, a decrease of 750 from the previous week's revised average. The previous week's average was revised up by 250 from 245,500 to 245,750.The following graph shows the 4-week moving average of weekly claims since 1971.
emphasis added
 Click on graph for larger image.
The dashed line on the graph is the current 4-week average. The four-week average of weekly unemployment claims decreased to 245,000.
The previous week was revised up.
Weekly claims were close to the consensus forecast.
Wednesday, June 25, 2025
Thursday: GDP, Unemployment Claims, Durable Goods, Pending Home Sales
by Calculated Risk on 6/25/2025 07:59:00 PM
 Note: Mortgage rates are from MortgageNewsDaily.com and are for top tier scenarios.
Thursday:
• At 8:30 AM: The initial weekly unemployment claims report will be released. The consensus is for initial claims to increase to 247 thousand from 245 thousand last week.
• At 8:30 AM: Gross Domestic Product, 1st quarter 2024 (Third estimate). The consensus is that real GDP decreased 0.2% annualized in Q1, unchanged from the second estimate of a 0.2% decrease.
• At 8:30 AM: Durable Goods Orders for May from the Census Bureau. The consensus is for a 4.5% increase in durable goods orders.
• At 8:30 AM ET: Chicago Fed National Activity Index for May. This is a composite index of other data.
• At 10:00 AM: Pending Home Sales Index for May. The consensus is for a 0.1% increase in this index.
• At 11:00 AM: the Kansas City Fed manufacturing survey for June.
• During the Day: Census Bureau releases the Vintage 2024 Population Estimates
June Vehicle Forecast: Sales "Subdued" at 15.0 million SAAR
by Calculated Risk on 6/25/2025 03:56:00 PM
From J.D. Power: June New-Vehicle Sales Subdued After Reverse of Tariff-Driven Rush to Showrooms; Retail Sales Rise 7.5% in First Half of 2025 Brief excerpt:
The seasonally adjusted annualized rate (SAAR) for total new-vehicle sales is expected to be 15.0 million units, up 0.2 million units from June 2024.From Haig Stoddard at Omdia: US Light-Vehicle Sales Slow Again in June (pay content). Brief excerpt:
emphasis added
Much of June’s anticipated 12-month-low in the seasonally adjusted annualized rate is an offset from pre-tariff pull-ahead volume in March and April. But also dampening demand is worsening affordability and leaner inventory. Furthermore, a dent in the year-ago month’s sales caused by a cyberattack impacting dealers’ online systems is making year-over-year comparisons look stronger than they would have otherwise.
 Click on graph for larger image.
This graph shows actual sales from the BEA (Blue), and J.D. Power's forecast for June (Red).
On a seasonally adjusted annual rate basis, the J.D. Power forecast of 15.0 million SAAR would be down 4.1% from last month, and up slightly from a year ago.
Car buyers rushed to buy in March and April to beat the tariffs. As Stoddard noted, the year-over-year comparison is easy due to the cyberattack suppressing sales last June.
A few comments on the Seasonal Pattern for House Prices
by Calculated Risk on 6/25/2025 02:11:00 PM
Another update ... a few key points:
1) There is a clear seasonal pattern for house prices.
2) The surge in distressed sales during the housing bust distorted the seasonal pattern. This was because distressed sales (at lower price points) happened at a steady rate all year, while regular sales followed the normal seasonal pattern. This made for larger swings in the seasonal factor during the housing bust.
3) The seasonal swings have increased recently without a surge in distressed sales.
 Click on graph for larger image.
This graph shows the month-to-month change in the NSA Case-Shiller National index since 1987 (through April 2025). The seasonal pattern was smaller back in the '90s and early '00s and increased once the bubble burst.
The seasonal swings declined following the bust, however the pandemic price surge changed the month-over-month pattern.
The peak MoM increase in NSA prices this year was the smallest since 2008!
 The second graph shows the seasonal factors for the Case-Shiller National index since 1987. The factors started to change near the peak of the bubble, and really increased during the bust since normal sales followed the regular seasonal pattern - and distressed sales happened all year.
The swings in the seasonal factors were decreasing following the bust but have increased again recently - this time without a surge in distressed sales.
 The second graph shows the seasonal factors for the Case-Shiller National index since 1987. The factors started to change near the peak of the bubble, and really increased during the bust since normal sales followed the regular seasonal pattern - and distressed sales happened all year.
 The swings in the seasonal factors were decreasing following the bust but have increased again recently - this time without a surge in distressed sales.
Newsletter: New Home Sales Decrease to 623,000 Annual Rate in May
by Calculated Risk on 6/25/2025 10:51:00 AM
Today, in the Calculated Risk Real Estate Newsletter: New Home Sales Decrease to 623,000 Annual Rate in May
Brief excerpt:
The Census Bureau reported New Home Sales in May were at a seasonally adjusted annual rate (SAAR) of 623 thousand. The previous three months were revised down.There is much more in the article.
...
The next graph shows new home sales for 2024 and 2025 by month (Seasonally Adjusted Annual Rate). Sales in May 2025 were down 6.3% from May 2024.
New home sales, seasonally adjusted, have been down year-over-year in 4 of the last 5 months.

New Home Sales Decrease to 623,000 Annual Rate in May
by Calculated Risk on 6/25/2025 10:00:00 AM
The Census Bureau reports New Home Sales in May were at a seasonally adjusted annual rate (SAAR) of 623 thousand.
The previous three months were revised down.
Sales of new single-family houses in May 2025 were at a seasonally-adjusted annual rate of 623,000, according to estimates released jointly today by the U.S. Census Bureau and the Department of Housing and Urban Development. This is 13.7 percent below the April 2025 rate of 722,000, and is 6.3 percent below the May 2024 rate of 665,000.
emphasis added
Click on graph for larger image.The first graph shows New Home Sales vs. recessions since 1963. The dashed line is the current sales rate.
New home sales were below pre-pandemic levels.
The second graph shows New Home Months of Supply.
 The months of supply increased in May to 9.8 months from 8.3 months in April.
 The all-time record high was 12.2 months of supply in January 2009. The all-time record low was 3.3 months in August 2020.
This is well above the top of the normal range (about 4 to 6 months of supply is normal).
"The seasonally-adjusted estimate of new houses for sale at the end of May 2025 was 507,000. This is 1.4 percent above the April 2025 estimate of 500,000, and is 8.1 percent above the May 2024 estimate of 469,000.Sales were well below expectations of 710 thousand SAAR and sales for the three previous months were revised down. I'll have more later today.
This represents a supply of 9.8 months at the current sales rate. The months' supply is 18.1 percent above the April 2025 estimate of 8.3 months, and is 15.3 percent above the May 2024 estimate of 8.5 months. "
MBA: Mortgage Applications Increase in Latest MBA Weekly Survey
by Calculated Risk on 6/25/2025 07:00:00 AM
From the MBA: Mortgage Applications Increase in Latest MBA Weekly Survey
Mortgage applications increased 1.1 percent from one week earlier, according to data from the Mortgage Bankers Association’s (MBA) Weekly Mortgage Applications Survey for the week ending June 20, 2025. This week’s results include an adjustment for the Juneteenth holiday.
The Market Composite Index, a measure of mortgage loan application volume, increased 1.1 percent on a seasonally adjusted basis from one week earlier. On an unadjusted basis, the Index decreased 10 percent compared with the previous week. The Refinance Index increased 3 percent from the previous week and was 29 percent higher than the same week one year ago. The seasonally adjusted Purchase Index decreased 0.4 percent from one week earlier. The unadjusted Purchase Index decreased 11 percent compared with the previous week and was 12 percent higher than the same week one year ago.
“The combination of the ongoing conflict in the Middle East, current economic conditions, and last week’s FOMC meeting resulted in slightly lower Treasury rates on average. However, mortgage rates still edged higher but remained in the same narrow range, with the 30-year fixed rate increasing to 6.88 percent last week,” said Joel Kan, MBA’s Vice President and Deputy Chief Economist. “Applications increased slightly overall driven by FHA refinances, but conventional applications saw declines over the week. The average loan size for purchase applications declined to $436,300, the lowest level since January 2025, driven by decreasing conventional purchase loan sizes.”
...
The average contract interest rate for 30-year fixed-rate mortgages with conforming loan balances ($806,500 or less) increased to 6.88 percent from 6.84 percent, with points decreasing to 0.63 from 0.66 (including the origination fee) for 80 percent loan-to-value ratio (LTV) loans.
emphasis added
 Click on graph for larger image.
The first graph shows the MBA mortgage purchase index.
According to the MBA, purchase activity is up 12% year-over-year unadjusted.
Red is a four-week average (blue is weekly).
Purchase application activity is still depressed, but above the lows of October 2023 and is 9% above the lowest levels during the housing bust.

The second graph shows the refinance index since 1990.
The refinance index increased but remained very low.
Tuesday, June 24, 2025
Wednesday: New Home Sales, Fed Chair Powell Testimony
by Calculated Risk on 6/24/2025 07:45:00 PM
 Note: Mortgage rates are from MortgageNewsDaily.com and are for top tier scenarios.
Wednesday:
• At 7:00 AM ET, The Mortgage Bankers Association (MBA) will release the results for the mortgage purchase applications index.
• At 10:00 AM, New Home Sales for May from the Census Bureau. The consensus is for 710 thousand SAAR, down from 743 thousand in April.
• Also at 10:00 AM, Testimony, Fed Chair Jerome Powell, Semiannual Monetary Policy Report to Congress, Before the U.S. Senate Committee on Banking, Housing, and Urban Affairs
ICE First Look at May Mortgage Performance: "Delinquencies Hold Steady and Foreclosure Sales Rise to Highest Level Since Early 2023"
by Calculated Risk on 6/24/2025 04:06:00 PM
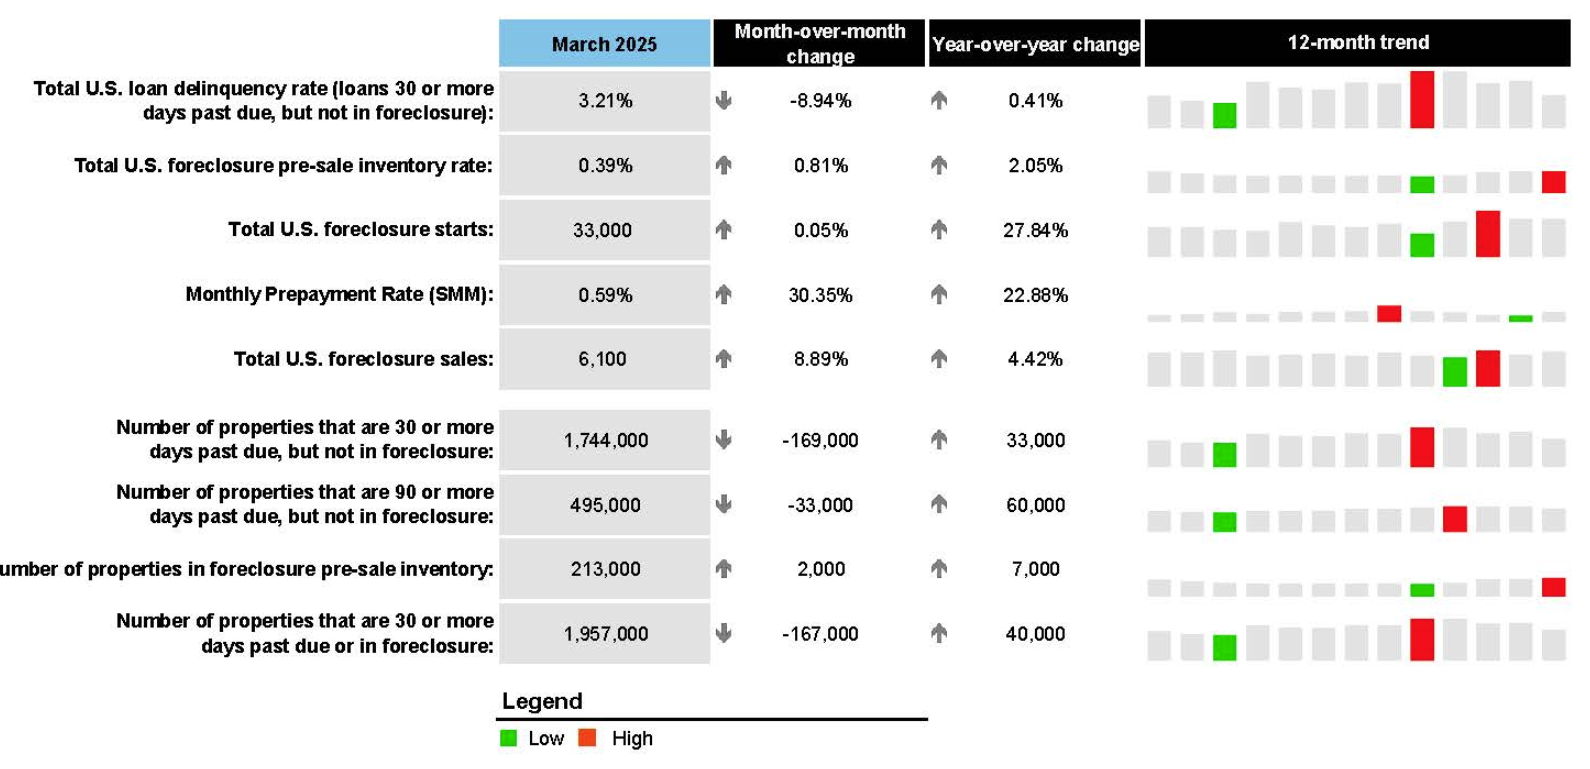
From Intercontinental Exchange: ICE First Look at Mortgage Performance: Delinquencies Hold Steady and Foreclosure Sales Rise to Highest Level Since Early 2023
Intercontinental Exchange, Inc. (NYSE:ICE) ... today released its May 2025 ICE First Look, which shows that delinquencies and foreclosure activity continues to trend slightly higher on an annual basis despite some seasonal and disaster recovery related improvement.
The ICE First Look reports on month-end delinquency, foreclosure and prepayment statistics sourced from its loan-level database, which covers a majority of the U.S. mortgage market. Key takeaways from this month’s findings include:
• The national delinquency rate ticked down 2 basis points (bps) to 3.20% in May, though it is up 5.2% (16 bps) year over year (YoY).
• Serious delinquencies – loans 90+ days past due but not in foreclosure – improved seasonally for the fifth consecutive month, but are still up 56K (14%) from the same time last year.
• Disaster-related delinquencies also improved, with those related to the 2024 hurricane season falling by nearly 5K (26%) month over month (MoM) and Los Angeles wildfire-related delinquencies falling by a more modest 9% MoM.
• Foreclosure starts and active foreclosure inventories climbed YoY, with May’s 7K foreclosure sales marking the largest single-month volume in more than two years.
• Prepayment activity, as measured by single month mortality, inched up to 0.71%, the highest level since October 2024, driven by a seasonal rise in home sale-related prepayments. Prepayments were up 23.4% YoY.
emphasis added
 Click on graph for larger image.
Here is a table from ICE.
Hotels: Occupancy Rate Decreased 2.4% Year-over-year
by Calculated Risk on 6/24/2025 01:16:00 PM
The U.S. hotel industry reported mostly negative year-over-year comparisons, according to CoStar’s latest data through 14 June. ...The following graph shows the seasonal pattern for the hotel occupancy rate using the four-week average.
8-14 June 2025 (percentage change from comparable week in 2024):
• Occupancy: 68.6% (-2.4%)
• Average daily rate (ADR): US$163.43 (+0.6%)
• Revenue per available room (RevPAR): US$112.11 (-1.8%)
emphasis added
 Click on graph for larger image.
The red line is for 2025, blue is the median, and dashed light blue is for 2024. Dashed purple is for 2018, the record year for hotel occupancy.
The 4-week average of the occupancy rate is tracking behind both last year and the median rate for the period 2000 through 2024 (Blue).
Note: Y-axis doesn't start at zero to better show the seasonal change.
The 4-week average will increase during the summer travel season; however, we will likely see a hit to occupancy during the summer months due to less international tourism.
Newsletter: Case-Shiller: National House Price Index Up 2.7% year-over-year in April
by Calculated Risk on 6/24/2025 09:39:00 AM
Today, in the Calculated Risk Real Estate Newsletter: Case-Shiller: National House Price Index Up 2.7% year-over-year in April
Excerpt:
S&P/Case-Shiller released the monthly Home Price Indices for April ("April" is a 3-month average of February, March and April closing prices). February closing prices include some contracts signed in December, so there is a significant lag to this data. Here is a graph of the month-over-month (MoM) change in the Case-Shiller National Index Seasonally Adjusted (SA).
The MoM decrease in the seasonally adjusted (SA) Case-Shiller National Index was at -0.51% (a -4.8% annual rate). This was the second consecutive MoM decrease.
On a seasonally adjusted basis, prices increased month-to-month in just 5 of the 20 Case-Shiller cities. San Francisco has fallen 6.4% from the recent peak, Tampa is down 2.7% from the peak, and Denver down 2.0%.

Case-Shiller: National House Price Index Up 2.7% year-over-year in April
by Calculated Risk on 6/24/2025 09:00:00 AM
S&P/Case-Shiller released the monthly Home Price Indices for April ("April" is a 3-month average of February, March and April closing prices).
This release includes prices for 20 individual cities, two composite indices (for 10 cities and 20 cities) and the monthly National index.
From S&P S&P CoreLogic Case-Shiller Index Records 2.7% Annual Gain in April 2025
The S&P CoreLogic Case-Shiller U.S. National Home Price NSA Index, covering all nine U.S. census divisions, reported a 2.7% annual return for April, down from a 3.4% annual gain in the previous month. The 10-City Composite saw an annual increase of 4.1%, down from a 4.8% annual increase in the previous month. The 20-City Composite posted a year-over-year increase of 3.4%, down from a 4.1% increase in the previous month. New York again reported the highest annual gain among the 20 cities with a 7.9% increase in April, followed by Chicago and Detroit with annual increases of 6.0% and 5.5%, respectively. Tampa posted the lowest return, falling 2.2%.
...
The pre-seasonally adjusted U.S. National Index saw slight upward trends in April, posting gains of 0.6%. The 10-City Composite and 20-City Composite Indices both reported gains of 0.7%.
After seasonal adjustment, the U.S. National Index posted a decrease of -0.4%. Both the 10-City Composite and the 20-City Composite Indices saw a -0.3% decrease.
“The housing market continued its gradual deceleration in April, with annual price gains slowing to their most modest pace in nearly two years,” said Nicholas Godec, CFA, CAIA, CIPM, Head of Fixed Income Tradables & Commodities at S&P Dow Jones Indices. “What's particularly striking is how this cycle has reshuffled regional leadership—markets that were pandemic darlings are now lagging, while historically steady performers in the Midwest and Northeast are setting the pace. This rotation signals a maturing market that's increasingly driven by fundamentals rather than speculative fervor.
“The National Composite Index posted a 2.7% annual gain in April, marking its slowest year-over-year appreciation since mid-2023. This deceleration was broad-based, with the 20-City Composite advancing 3.4% and the 10-City Composite up 4.1%—both substantially below their recent peaks. The composition of these gains tells an important story: Approximately 1.7 percentage points of April's annual increase occurred over the past six months, indicating that price momentum has been concentrated in the recent spring selling season rather than sustained throughout the year. "
emphasis added
 Click on graph for larger image.
 The first graph shows the nominal seasonally adjusted Composite 10, Composite 20 and National indices (the Composite 20 was started in January 2000).
The Composite 10 index was down 0.3% in April (SA). The Composite 20 index was down 0.3% (SA) in April.
The National index was down 0.4% (SA) in April.
 The second graph shows the year-over-year change in all three indices.
The Composite 10 NSA was up 4.1% year-over-year. The Composite 20 NSA was up 3.4% year-over-year.
The National index NSA was up 2.7% year-over-year.
Annual price changes were lower than expectations. I'll have more later.
Monday, June 23, 2025
Tuesday: Case-Shiller House Prices, Fed Chair Powell Testimony
by Calculated Risk on 6/23/2025 08:11:00 PM
 From Matthew Graham at Mortgage News Daily: Mortgage Rates Lowest Since May 1st
Mortgage rates ended the previous week roughly in line with the best levels since May 1st. Today's modest improvement made it official.Tuesday:
Mortgage rates are primarily a function of trading levels in the bond market and bonds have had a few reasons to move at the start of the new week.
There's a small case to be made that U.S. involvement in the conflict between Israel and Iran contributed to bond market strength and, thus, lower mortgage rates today. [30 year fixed 6.84%]
emphasis added
• At 9:00 AM ET, S&P/Case-Shiller House Price Index for April. The National index was up 3.4% year-over-year in March.
• Also at 9:00 AM, FHFA House Price Index for April. This was originally a GSE only repeat sales, however there is also an expanded index.
• At 10:00 AM, Richmond Fed Survey of Manufacturing Activity for June.
• Also at 10:00 AM, State Employment and Unemployment (Monthly) for May 2024.
• Also at 10:00 AM, Testimony, Fed Chair Jerome Powell, Semiannual Monetary Policy Report to Congress, Before the U.S. House Financial Services Committee
A Very Early Look at 2026 Cost-Of-Living Adjustments and Maximum Contribution Base
by Calculated Risk on 6/23/2025 02:27:00 PM
The BLS reported earlier this month:
The Consumer Price Index for Urban Wage Earners and Clerical Workers (CPI-W) increased 2.2 percent over the last 12 months to an index level of 314.839 (1982-84=100). For the month, the index increased 0.2 percent prior to seasonal adjustment.CPI-W is the index that is used to calculate the Cost-Of-Living Adjustments (COLA). The calculation dates have changed over time (see Cost-of-Living Adjustments), but the current calculation uses the average CPI-W for the three months in Q3 (July, August, September) and compares to the average for the highest previous average of Q3 months. Note: this is not the headline CPI-U and is not seasonally adjusted (NSA).
• In 2024, the Q3 average of CPI-W was 308.729.
The 2024 Q3 average was the highest Q3 average, so we only have to compare Q3 this year to last year.
 Click on graph for larger image.
This graph shows CPI-W since January 2000. The red lines are the Q3 average of CPI-W for each year.
Note: The year labeled is for the calculation, and the adjustment is effective for December of that year (received by beneficiaries in January of the following year).
CPI-W was up 2.2% year-over-year in May, and although this is very early - we need the data for July, August and September - my very early guess is COLA will probably be in the 2% to 3% range again this year, possibly the smallest increase since 1.3% in 2021 (the increase was 2.5% for 2025).
Contribution and Benefit Base
The contribution base will be adjusted using the National Average Wage Index. This is based on a one-year lag. The National Average Wage Index is not available for 2024 yet, although we know wages increased solidly in 2024. If wages increased 5% in 2024, then the contribution base next year will increase to around $185,000 in 2026, from the current $176,100.
Remember - this is a very early look. What matters is average CPI-W, NSA, for all three months in Q3 (July, August and September).
Newsletter: NAR: Existing-Home Sales Increased to 4.03 million SAAR in May; Down 0.7% YoY
by Calculated Risk on 6/23/2025 10:50:00 AM
Today, in the CalculatedRisk Real Estate Newsletter: NAR: Existing-Home Sales Increased to 4.03 million SAAR in May; Down 0.7% YoY
Excerpt:
Sales in May (4.03 million SAAR) were up 0.8% from the previous month and were 0.7% below the May 2024 sales rate. This was the 4th consecutive month with a year-over-year decline in sales. ... The sales rate was above the consensus forecast (but right at housing economist Tom Lawler’s estimate).There is much more in the article.
...
Sales Year-over-Year and Not Seasonally Adjusted (NSA)
The fourth graph shows existing home sales by month for 2024 and 2025.
Sales decreased 0.7% year-over-year compared to May 2024. This was the 4th consecutive month with a year-over-year decline. The next four months will have the easiest year-over-year comparisons.
...
On an NSA basis for the month of May, this was 3% above the low for housing bust for the month of May that happened in May 2009. Year-to-date, sales are down 2.8% NSA.

NAR: Existing-Home Sales Increased to 4.03 million SAAR in May; Down 0.7% YoY
by Calculated Risk on 6/23/2025 10:00:00 AM
From the NAR: NAR Existing-Home Sales Report Shows 0.8% Increase in May
Existing-home sales rose in May, according to the National Association of REALTORS®. Sales elevated in the Northeast, Midwest and South, but retreated in the West. Year-over-year, sales progressed in the Northeast and Midwest but contracted in the South and West. ...
• 0.8% increase in total existing-home sales month-over-month to a seasonally adjusted annual rate of 4.03 million.
• 0.7% decrease year-over-year, sales declined 0.7% (down from 4.06 million in May 2024).
• 1.54 million units: Total housing inventory, up 6.2% from April and 20.3% from May 2024 (1.28 million).
• 4.6-month supply of unsold inventory, up from 4.4 months in April and 3.8 months in May 2024.
emphasis added
 Click on graph for larger image.
This graph shows existing home sales, on a Seasonally Adjusted Annual Rate (SAAR) basis since 1994.
Sales in May (4.03 million SAAR) were up 0.8% from the previous month and were 0.7% below the May 2024 sales rate. This was the 4th consecutive month with a year--over-year decline in sales.
The second graph shows nationwide inventory for existing homes.
 According to the NAR, inventory increased to 1.54 million in May from 1.45 million the previous month.
 According to the NAR, inventory increased to 1.54 million in May from 1.45 million the previous month.
Headline inventory is not seasonally adjusted, and inventory usually decreases to the seasonal lows in December and January, and peaks in mid-to-late summer.
The last graph shows the year-over-year (YoY) change in reported existing home inventory and months-of-supply. Since inventory is not seasonally adjusted, it really helps to look at the YoY change. Note: Months-of-supply is based on the seasonally adjusted sales and not seasonally adjusted inventory.
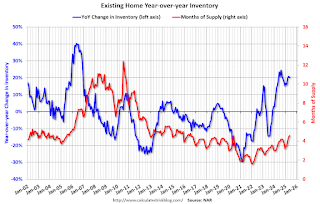 Inventory was up 20.3% year-over-year (blue) in May compared to May 2024.
Months of supply (red) increased to 4.6 months in May from 4.4 months the previous month.
As expected, the sales rate was above the consensus forecast. I'll have more later.
The last graph shows the year-over-year (YoY) change in reported existing home inventory and months-of-supply. Since inventory is not seasonally adjusted, it really helps to look at the YoY change. Note: Months-of-supply is based on the seasonally adjusted sales and not seasonally adjusted inventory.
 Inventory was up 20.3% year-over-year (blue) in May compared to May 2024.
 Months of supply (red) increased to 4.6 months in May from 4.4 months the previous month.
As expected, the sales rate was above the consensus forecast. I'll have more later.
Housing June 23rd Weekly Update: Inventory up 0.4% Week-over-week, Up 30.7% Year-over-year
by Calculated Risk on 6/23/2025 08:11:00 AM
Altos reports that active single-family inventory was up 0.4% week-over-week.
Inventory is now up 32.7% from the seasonal bottom in January and is increasing.
Usually, inventory is up about 18% to 19% from the seasonal low by this week in the year. So, 2025 is seeing a larger than normal pickup in inventory.
The first graph shows the seasonal pattern for active single-family inventory since 2015.
 Click on graph for larger image.
The red line is for 2025. The black line is for 2019.
Inventory was up 30.7% compared to the same week in 2024 (last week it was up 33.1%), and down 13.2% compared to the same week in 2019 (last week it was down 12.4%).
This is the highest level since 2019.
It now appears inventory will be close to 2019 levels towards the end of 2025.
 This second inventory graph is courtesy of Altos Research.
As of June 20th, inventory was at 829 thousand (7-day average), compared to 826 thousand the prior week.
Mike Simonsen discusses this data regularly on Youtube
Sunday, June 22, 2025
Monday: Existing Home Sales
by Calculated Risk on 6/22/2025 06:15:00 PM
Weekend:
• Schedule for Week of June 22, 2025
Monday:
• At 10:00 AM ET, Existing Home Sales for May from the National Association of Realtors (NAR). The consensus is for 3.95 million SAAR, down from 4.00 million in April.
From CNBC: Pre-Market Data and Bloomberg futures S&P 500 are down 35 and DOW futures are down 221 (fair value).
Oil prices were up over the last week with WTI futures at $76.96 per barrel and Brent at $80.28 per barrel. A year ago, WTI was at $82, and Brent was at $86 - so WTI oil prices are down about 6% year-over-year.
Here is a graph from Gasbuddy.com for nationwide gasoline prices. Nationally prices are at $3.19 per gallon. A year ago, prices were at $3.41 per gallon, so gasoline prices are down $0.22 year-over-year.
Update: Lumber Prices Up 36% YoY
by Calculated Risk on 6/22/2025 08:48:00 AM
This is something to watch again. Here is another monthly update on lumber prices.
SPECIAL NOTE: The CME group discontinued the Random Length Lumber Futures contract on May 16, 2023. I switched to a physically-delivered Lumber Futures contract that was started in August 2022. Unfortunately, this impacts long term price comparisons since the new contract was priced about 24% higher than the old random length contract for the period when both contracts were available.
This graph shows CME random length framing futures through August 2022 (blue), and the new physically-delivered Lumber Futures (LBR) contract starting in August 2022 (Red).
On June 20, 2025, LBR was at $616.00 per 1,000 board feet, up 36% from a year ago.
 Click on graph for larger image.
There is somewhat of a seasonal demand for lumber, and lumber prices frequently peak in the first half of the year.
Note that last year prices bottomed in early July at $449.00 per 1,000 board feet, so the next few weeks will be the most difficult year-over-year comparison.
The pickup in early 2018 was due to the Trump lumber tariffs in 2017. There were huge increases during the pandemic due to a combination of supply constraints and a pickup in housing starts.
Saturday, June 21, 2025
Real Estate Newsletter Articles this Week: Housing Starts Decreased to 1.256 million SAAR
by Calculated Risk on 6/21/2025 02:11:00 PM
At the Calculated Risk Real Estate Newsletter this week:
 Click on graph for larger image.
• Housing Starts Decreased to 1.256 million Annual Rate in May
• California Home Sales "Sputter" in May; 4th Look at Local Markets
• Housing Market Index and Single Family Starts
• 3rd Look at Local Housing Markets in May
This is usually published 4 to 6 times a week and provides more in-depth analysis of the housing market.


