 RSS Feed
 by Calculated Risk on 11/30/2024 02:11:00 PM
Saturday, November 30, 2024
Real Estate Newsletter Articles this Week: National House Price Index Up 3.9% year-over-year in September
At the Calculated Risk Real Estate Newsletter this week:
 Click on graph for larger image.
• Case-Shiller: National House Price Index Up 3.9% year-over-year in September
• New Home Sales Decrease Sharply to 610,000 Annual Rate in October
• Fannie and Freddie: Single Family and Multi-Family Serious Delinquency Rates Increased in October
• Final Look at Local Housing Markets in October and a Look Ahead to November Sales
This is usually published 4 to 6 times a week and provides more in-depth analysis of the housing market.
Schedule for Week of December 1, 2024
by Calculated Risk on 11/30/2024 08:11:00 AM
The key report this week is the November employment report on Friday.
Other key indicators include the October Trade Deficit, the November ISM manufacturing index and November vehicle sales.
10:00 AM: ISM Manufacturing Index for November. The consensus is for 47.5%, up from 46.5%.
10:00 AM: Construction Spending for October. The consensus is for 0.2% increase in spending.
 All day: Light vehicle sales for November.
The consensus is for 16.0 million SAAR in November, unchanged from the BEA estimate of 16.04 million SAAR in October (Seasonally Adjusted Annual Rate).
This graph shows light vehicle sales since the BEA started keeping data in 1967.
The dashed line is the current sales rate.
----- Tuesday, December 3rd -----
 10:00 AM: Job Openings and Labor Turnover Survey for October from the BLS.
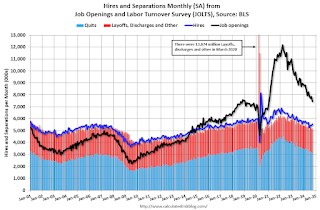
This graph shows job openings (black line), hires (purple), Layoff, Discharges and other (red column), and Quits (light blue column) from the JOLTS.
Jobs openings decreased in September to 7.44 million from 7.86 million in August.
The number of job openings (black) were down 20% year-over-year. Quits were down 15% year-over-year.
----- Wednesday, December 4th -----
7:00 AM ET: The Mortgage Bankers Association (MBA) will release the results for the mortgage purchase applications index.
8:15 AM: The ADP Employment Report for November. This report is for private payrolls only (no government). The consensus is for 166,000 jobs added, down from 233,000 in October.
10:00 AM: the ISM Services Index for November. The consensus is for 55.5, down from 56.0.
1:45 PM: Discussion, Fed Chair Jerome Powell, Moderated Discussion, At the New York Times DealBook Summit, New York, N.Y.
2:00 PM: the Federal Reserve Beige Book, an informal review by the Federal Reserve Banks of current economic conditions in their Districts.
----- Thursday, December 5th -----
8:30 AM: The initial weekly unemployment claims report will be released. The consensus is for 220 thousand initial claims, up from 213 thousand last week.
 8:30 AM: Trade Balance report for October from the Census Bureau.
This graph shows the U.S. trade deficit, with and without petroleum, through the most recent report. The blue line is the total deficit, and the black line is the petroleum deficit, and the red line is the trade deficit ex-petroleum products.
The consensus is the trade deficit to be $78.8 billion. The U.S. trade deficit was at $84.4 billion in September.
----- Friday, December 6th -----
 8:30 AM: Employment Report for November. The consensus is for 183,000 jobs added, and for the unemployment rate to be unchanged at 4.1%.
There were 12,000 jobs added in October, and the unemployment rate was at 4.1%.
This graph shows the jobs added per month since January 2021.
10:00 AM: University of Michigan's Consumer sentiment index (Preliminary for December).
 10:00 AM: Job Openings and Labor Turnover Survey for October from the BLS.
 This graph shows job openings (black line), hires (purple), Layoff, Discharges and other (red column), and Quits (light blue column) from the JOLTS.
Jobs openings decreased in September to 7.44 million from 7.86 million in August.
The number of job openings (black) were down 20% year-over-year. Quits were down 15% year-over-year.
7:00 AM ET: The Mortgage Bankers Association (MBA) will release the results for the mortgage purchase applications index.
8:15 AM: The ADP Employment Report for November. This report is for private payrolls only (no government). The consensus is for 166,000 jobs added, down from 233,000 in October.
10:00 AM: the ISM Services Index for November. The consensus is for 55.5, down from 56.0.
1:45 PM: Discussion, Fed Chair Jerome Powell, Moderated Discussion, At the New York Times DealBook Summit, New York, N.Y.
2:00 PM: the Federal Reserve Beige Book, an informal review by the Federal Reserve Banks of current economic conditions in their Districts.
8:30 AM: The initial weekly unemployment claims report will be released. The consensus is for 220 thousand initial claims, up from 213 thousand last week.
 8:30 AM: Trade Balance report for October from the Census Bureau.
 This graph shows the U.S. trade deficit, with and without petroleum, through the most recent report. The blue line is the total deficit, and the black line is the petroleum deficit, and the red line is the trade deficit ex-petroleum products.
The consensus is the trade deficit to be $78.8 billion. The U.S. trade deficit was at $84.4 billion in September.
 8:30 AM: Employment Report for November. The consensus is for 183,000 jobs added, and for the unemployment rate to be unchanged at 4.1%.
There were 12,000 jobs added in October, and the unemployment rate was at 4.1%.
This graph shows the jobs added per month since January 2021.
10:00 AM: University of Michigan's Consumer sentiment index (Preliminary for December).
Friday, November 29, 2024
Hotels: Occupancy Rate Increased 21.7% Year-over-year due to Timing of Thanksgiving
by Calculated Risk on 11/29/2024 12:21:00 PM
Due to the Thanksgiving calendar shift, the U.S. hotel industry reported higher year-over-year performance comparisons, according to CoStar’s latest data through 23 November. ...The following graph shows the seasonal pattern for the hotel occupancy rate using the four-week average.
17-23 November 2024 (percentage change from comparable week in 2023):
• Occupancy: 59.7% (+20.7%)
• Average daily rate (ADR): US$150.49 (+8.6%)
• Revenue per available room (RevPAR): US$89.80 (+31.1%)
emphasis added
 Click on graph for larger image.
The red line is for 2024, blue is the median, and dashed light blue is for 2023. Dashed purple is for 2018, the record year for hotel occupancy.
The 4-week average of the occupancy rate is above both last year and the median rate for the period 2000 through 2023 (Blue) - and will likely finish mostly unchanged year-over-year.
Note: Y-axis doesn't start at zero to better show the seasonal change.
The 4-week average of the occupancy rate has peaked for the fall business travel season and will decline seasonally through the holidays. Note: Occupancy will be down sharply next week due to the timing of Thanksgiving (the reverse of this week).
Q4 GDP Tracking: Mid 2% Range
by Calculated Risk on 11/29/2024 09:11:00 AM
From Goldman:
Following [Wednesday]’s data, we have left our Q4 GDP tracking estimate unchanged at +2.4% (quarter-over-quarter annualized) and our Q4 domestic final sales forecast unchanged at +2.0%. [Nov 27th estimate]And from the Atlanta Fed: GDPNow
The GDPNow model estimate for real GDP growth (seasonally adjusted annual rate) in the fourth quarter of 2024 is 2.7 percent on November 27, up from 2.6 percent on November 19. After this morning's personal income and outlays release from the US Bureau of Economic Analysis, the nowcast of fourth-quarter real personal consumption expenditures growth increased from 2.8 percent to 3.0 percent. [Nov 27th estimate]
Thursday, November 28, 2024
Five Economic Reasons to be Thankful
by Calculated Risk on 11/28/2024 08:47:00 AM
Here are five economic reasons to be thankful this Thanksgiving. (Hat Tip to Neil Irwin who started doing this years ago)
1) The Unemployment Rate is at 4.1%
 The unemployment rate was at 4.1% in October.
The unemployment rate is down from 14.7% in April 2020 (the highest rate since the Great Depression).
The unemployment rate is up from 3.4% in April 2023 - and that matched the lowest unemployment rate since 1969!
The unemployment rate is up from 3.4% in April 2023 - and that matched the lowest unemployment rate since 1969!
This is a historically low unemployment rate.
2) Low unemployment claims.
 This graph shows the 4-week moving average of weekly claims since 1971.
The percent of loans in the foreclosure process are close to the record low.
5) Household Debt burdens at Low Levels (ex-pandemic)
 This graph, based on data from the Federal Reserve, shows the Household Debt Service Ratio (DSR), and the DSR for mortgages (blue) and consumer debt (yellow).
2) Low unemployment claims.
 This graph shows the 4-week moving average of weekly claims since 1971.
Weekly claims were at 213,000 last week.
The dashed line on the graph is the current 4-week average.
The dashed line on the graph is the current 4-week average.
Even though weekly claims have bounced around a little recently, the 4-week average is close to the lowest level in 50 years.
3) Mortgage Debt as a Percent of GDP has Fallen Significantly
 This graph shows household mortgage debt as a percent of GDP.
3) Mortgage Debt as a Percent of GDP has Fallen Significantly
 This graph shows household mortgage debt as a percent of GDP.
 Note this graph is through Q2 2024 was impacted by the sharp decline in Q2 2020 GDP.
Mortgage debt is up $2.34 trillion from the peak during the housing bubble, but, as a percent of GDP is at 45.9% - down from Q1 - and down from a peak of 73.3% of GDP during the housing bust.
4) Mortgage Delinquency Rate Near the Lowest Level since at least 1979

Mortgage debt is up $2.34 trillion from the peak during the housing bubble, but, as a percent of GDP is at 45.9% - down from Q1 - and down from a peak of 73.3% of GDP during the housing bust.
4) Mortgage Delinquency Rate Near the Lowest Level since at least 1979

This graph, based on data from the MBA through Q3 2024, shows the percent of loans delinquent by days past due.
Although mortgage delinquencies are up a little from Q2 2023 - the lowest level since the MBA survey started in 1979 - delinquencies are still historically very low.
Note: The sharp increase in 2020 in the 90-day bucket was due to loans in forbearance (included as delinquent but not reported to the credit bureaus).
The percent of loans in the foreclosure process are close to the record low.
5) Household Debt burdens at Low Levels (ex-pandemic)
 This graph, based on data from the Federal Reserve, shows the Household Debt Service Ratio (DSR), and the DSR for mortgages (blue) and consumer debt (yellow).
The Household debt service ratio was at 11.5% in Q2 2024, slightly below the pre-pandemic level of 11.6%.
The DSR for mortgages (blue) has increased recently but is close to the pre-pandemic level.
This data suggests aggregate household cash flow is in a solid position.
This data suggests aggregate household cash flow is in a solid position.
Happy Thanksgiving to All!
Wednesday, November 27, 2024
Realtor.com Reports Active Inventory Up 26.5% YoY
by Calculated Risk on 11/27/2024 05:16:00 PM
What this means: On a weekly basis, Realtor.com reports the year-over-year change in active inventory and new listings. On a monthly basis, they report total inventory. For October, Realtor.com reported inventory was up 29.2% YoY, but still down 21.1% compared to the 2017 to 2019 same month levels.
Now - on a weekly basis - inventory is up 26.5% YoY.
Realtor.com has monthly and weekly data on the existing home market. Here is their weekly report: Weekly Housing Trends View—Data for Week Ending Nov. 23, 2024 Here is a graph of the year-over-year change in inventory according to realtor.com.
Inventory was up year-over-year for the 55th consecutive week.
Realtor.com has monthly and weekly data on the existing home market. Here is their weekly report: Weekly Housing Trends View—Data for Week Ending Nov. 23, 2024
• Active inventory increased, with for-sale homes 26.5% above year-ago levels
For the 55th consecutive week, the number of homes for sale has increased compared to the same time last year. The nationwide market is slowly rebounding to pre-pandemic levels of inventory. Buyers currently have far more options than they did a few years ago, but with prices and mortgage rates remaining high, not as many of them are within their budget. New listings showed a much more modest increase, so most of this inventory growth is the result of homes sitting on the market for longer.
• New listings—a measure of sellers putting homes up for sale—climbed 2.8% this week compared with one year ago
The number of newly listed homes for sale continued to grow this week, the fourth in a row with year-over-year new listing growth over 1.5%. This is an encouraging sign that even amid a high mortgage rate environment, some sellers are willing to list their homes and make a move. We’ve talked extensively about the lock-in effect, where homeowners who secured a low-rate mortgage in recent years are reluctant to move out and give that favorable financing up, and there are only two cures for this issue. The first, lower mortgage rates, doesn’t appear to be coming any time soon. The second, time, is finally starting to take effect, as the simple reality that people eventually have to move will force new homes onto the market even if their sellers don’t love the mortgage rate they’ll get on their next purchase.
 Here is a graph of the year-over-year change in inventory according to realtor.com.
 Inventory was up year-over-year for the 55th consecutive week.
However, inventory is still historically low.
New listings remain below typical pre-pandemic levels.
Fannie and Freddie: Single Family and Multi-Family Serious Delinquency Rates Increased in October
by Calculated Risk on 11/27/2024 01:15:00 PM
Today, in the Calculated Risk Real Estate Newsletter: Fannie and Freddie: Single Family and Multi-Family Serious Delinquency Rates Increased in October
Excerpt:
Single-family serious delinquencies increased slightly in October, and multi-family serious delinquencies increased.
...
Multi-Family Delinquencies Increased, Fannie Rate Matches Highest Since 2011 (ex-Pandemic)
...
Freddie Mac reported that the Single-Family serious delinquency rate in October was 0.55%, up from 0.54% September. Freddie's rate is up slightly year-over-year from 0.54% in October 2023. This is below the pre-pandemic lows.
...
Fannie Mae reported that the Single-Family serious delinquency rate in October was 0.52%, unchanged from 0.52% in September. The serious delinquency rate is down year-over-year from 0.53% in October 2023. This is also below the pre-pandemic lows.

There is much more in the article.
Personal Income increased 0.6% in October; Spending increased 0.4%
by Calculated Risk on 11/27/2024 10:13:00 AM
The BEA released the Personal Income and Outlays, October 2024 report for October:
Personal income increased $147.4 billion (0.6 percent at a monthly rate) in October, according to estimates released today by the U.S. Bureau of Economic Analysis. Disposable personal income (DPI), personal income less personal current taxes, increased $144.1 billion (0.7 percent) and personal consumption expenditures (PCE) increased $72.3 billion (0.4 percent).The October PCE price index increased 2.3 percent year-over-year (YoY), up from 2.1 percent YoY in September, and down from the recent peak of 7.0 percent in June 2022.
The PCE price index increased 0.2 percent in October. Excluding food and energy, the PCE price index increased 0.3 percent. Real DPI increased 0.4 percent and real PCE increased 0.1 percent; goods increased less than 0.1 percent and services increased 0.2 percent.
emphasis added
The PCE price index, excluding food and energy, increased 2.8 percent YoY, up from 2.7 percent in September, and down from the recent peak of 5.4 percent in February 2022.
The following graph shows real Personal Consumption Expenditures (PCE) through October 2024 (2017 dollars). Note that the y-axis doesn't start at zero to better show the change.
 Click on graph for larger image.
The dashed red lines are the quarterly levels for real PCE.
Personal income was above expectations, and PCE was at expectations.
Inflation was close to expectations.
NAR: Pending Home Sales Increase 2.0% in October; Up 5.4% Year-over-year
by Calculated Risk on 11/27/2024 10:03:00 AM
From the NAR: Pending Home Sales Climbed 2.0% in October, Third Straight Month of Gains
Pending home sales ascended in October – the third consecutive month of increases – according to the National Association of REALTORS®. All four major U.S. regions experienced month-over-month gains in transactions, with the Northeast leading the way. Year-over-year, contract signings increased in all four U.S. regions, led by the West.Note: Contract signings usually lead sales by about 45 to 60 days, so this would usually be for closed sales in November and December.
The Pending Home Sales Index (PHSI)* – a forward-looking indicator of home sales based on contract signings – elevated 2.0% to 77.4 in October. Year-over-year, pending transactions expanded 5.4%. An index of 100 is equal to the level of contract activity in 2001.
"Homebuying momentum is building after nearly two years of suppressed home sales." said NAR Chief Economist Lawrence Yun. "Even with mortgage rates modestly rising despite the Federal Reserve's decision to cut the short-term interbank lending rate in September, continuous job additions and more housing inventory are bringing more consumers to the market."
...
he Northeast PHSI jumped 4.7% from last month to 68.7, up 7.2% from October 2023. The Midwest index grew 4.0% to 77.8 in October, up 1.8% from the previous year.
The South PHSI increased 0.9% to 90.0 in October, up 2.5% from a year ago. The West index edged higher by 0.2% from the prior month to 64.1, up 16.8% from October 2023.
emphasis added
Q3 GDP Growth Unrevised at 2.8% Annual Rate
by Calculated Risk on 11/27/2024 08:36:00 AM
From the BEA: Gross Domestic Product, Third Quarter 2024 (Second Estimate) and Corporate Profits (Preliminary)
Real gross domestic product (GDP) increased at an annual rate of 2.8 percent in the third quarter of 2024, according to the "second" estimate released by the U.S. Bureau of Economic Analysis. In the second quarter, real GDP increased 3.0 percent.Here is a Comparison of Second and Advance Estimates. PCE growth was revised down from 3.7% to 3.5%. Residential investment was revised up from -5.1% to -5.0%.
The GDP estimate released today is based on more complete source data than were available for the "advance" estimate issued last month. In the advance estimate, the increase in real GDP was also 2.8 percent. The update primarily reflected upward revisions to private inventory investment and nonresidential fixed investment as well as downward revisions to exports and consumer spending. Imports, which are a subtraction in the calculation of GDP, were revised down.
emphasis added
Weekly Initial Unemployment Claims Decrease to 213,000
by Calculated Risk on 11/27/2024 08:33:00 AM
The DOL reported:
In the week ending November 23, the advance figure for seasonally adjusted initial claims was 213,000, a decrease of 2,000 from the previous week's revised level. The previous week's level was revised up by 2,000 from 213,000 to 215,000. The 4-week moving average was 217,000, a decrease of 1,250 from the previous week's revised average. The previous week's average was revised up by 500 from 217,750 to 218,250.The following graph shows the 4-week moving average of weekly claims since 1971.
emphasis added
Click on graph for larger image.The dashed line on the graph is the current 4-week average. The four-week average of weekly unemployment claims decreased to 217,000.
The previous week was revised up.
Weekly claims were below the consensus forecast.
MBA: Mortgage Applications Increased in Weekly Survey
by Calculated Risk on 11/27/2024 07:00:00 AM
From the MBA: Mortgage Applications Increase in Latest MBA Weekly Survey
— Mortgage applications increased 6.3 percent from one week earlier, according to data from the Mortgage Bankers Association’s (MBA) Weekly Mortgage Applications Survey for the week ending November 22, 2024.
The Market Composite Index, a measure of mortgage loan application volume, increased 6.3 percent on a seasonally adjusted basis from one week earlier. On an unadjusted basis, the Index increased 3 percent compared with the previous week. The Refinance Index decreased 3 percent from the previous week and was 119 percent higher than the same week one year ago. The seasonally adjusted Purchase Index increased 12 percent from one week earlier. The unadjusted Purchase Index increased 7 percent compared with the previous week and was 52 percent higher than the same week one year ago.
“Purchase activity drove overall applications higher last week, as conventional purchase applications picked up pace and mortgage rates declined for the first time in over two months, with the 30-year fixed rate dropping slightly to 6.86 percent,” said Joel Kan, MBA’s Vice President and Deputy Chief Economist. With the growth in for-sale inventory and signs that the economy remains strong, buyers have remained in the market even though rates have increased recently. The increase in conventional purchase applications helped push the average purchase loan size to $439,200, its highest level in almost a month. The decline in refinance activity was driven by pullbacks in FHA and VA refinances. Applications were significantly higher than a year ago by most measures, but this was compared to the week of Thanksgiving 2023, which was a week earlier than this year’s holiday.”
...
The average contract interest rate for 30-year fixed-rate mortgages with conforming loan balances ($766,550 or less) decreased to 6.86 percent from 6.90 percent, with points remaining unchanged at 0.70 (including the origination fee) for 80 percent loan-to-value ratio (LTV) loans.
emphasis added
 Click on graph for larger image.
The first graph shows the MBA mortgage purchase index.
According to the MBA, purchase activity is up 52% year-over-year unadjusted (due to timing of Thanksgiving - this will be down sharply next week).
Red is a four-week average (blue is weekly).
Purchase application activity is up about 22% from the lows in late October 2023 and is close to the lowest levels during the housing bust.

The second graph shows the refinance index since 1990.
With higher mortgage rates, the refinance index increased as mortgage rates declined in September but has decreased as rates moved back up.
Tuesday, November 26, 2024
Wednesday: GDP, Unemployment Claims, Durable Goods, Personal Income & Outlays, Pending Home Sales
by Calculated Risk on 11/26/2024 07:48:00 PM
 Note: Mortgage rates are from MortgageNewsDaily.com and are for top tier scenarios.
Wednesday:
• At 7:00 AM ET, The Mortgage Bankers Association (MBA) will release the results for the mortgage purchase applications index.
• At 8:30 AM, The initial weekly unemployment claims report will be released. The consensus is for 220 thousand initial claims, up from 213 thousand last week.
• Also at 8:30 AM, Gross Domestic Product (Second Estimate) and Corporate Profits (Preliminary), 3rd Quarter 2024. The consensus is that real GDP increased 2.8% annualized in Q3, unchanged from the advance estimate of 2.8% in Q3.
• Also at 8:30 AM, Durable Goods Orders for October from the Census Bureau. The consensus is for a 0.1% increase in durable goods orders.
• At 9:45 AM, Chicago Purchasing Managers Index for November.
• At 10:00 AM, Personal Income and Outlays, October 2024. The consensus is for a 0.3% increase in personal income, and for a 0.4% increase in personal spending. And for the Core PCE price index to increase 0.3%. PCE prices are expected to be up 2.1% YoY, and core PCE prices up 2.7% YoY.
• Also at 10:00 AM, Pending Home Sales Index for October.
ICE: "Home price growth edged slightly higher in October"
by Calculated Risk on 11/26/2024 04:03:00 PM
The ICE HPI is a repeat sales index. ICE reports the median price change of the repeat sales.
From Intercontinental Exchange (ICE):
• Home price growth edged slightly higher in October to +3.0% (from +2.9% in September), after easing in each of the previous seven months
• Lower interest rates in August and September combined with weaker Q4 2023 growth numbers cycling out of the 12-month calculation window to cause the slight rise in year-over-year growth
• Annual gains will continue to see upward pressure from Q4 2023 numbers rolling off the books over the next few months, but that annual growth rate should begin to soften again as we move into early 2025, if monthly price gains continue at their current pace
• Rising interest rates in the lead up to, and following, the recent presidential election have led to a modest pull back in demand, which could also lead to softer price gains as we make our way into early 2025
FOMC Minutes: "appropriate to move gradually toward a more neutral stance"
by Calculated Risk on 11/26/2024 02:22:00 PM
From the Fed: Minutes of the Federal Open Market Committee, November 6–7, 2024. Excerpt:
In their discussion of financial stability, participants who commented noted vulnerabilities to the financial system that they assessed warranted monitoring. A couple of participants observed that the banking system was sound but that there continued to be potential risks associated with unrealized losses on bank assets. Many participants discussed vulnerabilities associated with CRE exposures, focusing on risks in the office sector. A few of these participants noted signs that the deterioration of conditions in this sector of the CRE market might be lessening. A couple of participants noted concerns about asset valuation pressures in other markets. Some participants commented on cyber risks that could impair the operation of financial institutions, financial infrastructure, and, potentially, the overall economy; these participants noted, in particular, vulnerabilities that could emanate from third-party service providers. A couple of participants also mentioned third-party service providers in the context of risks associated with brokered and reciprocal deposit arrangements. Several participants noted that leverage in the market for Treasury securities remained a risk and commented that it would be important to monitor developments regarding the market's resilience. A few participants discussed vulnerabilities posed by the growth of private credit and potential links to banks and other financial institutions. A couple of participants commented on the financial condition of low- and moderate-income households that have exhausted their savings and the importance of monitoring rising delinquency rates on credit cards and auto loans. A couple of participants remarked on the successful implementation of the Securities and Exchange Commission's money fund rules, noting that it would reduce financial stability risks posed by domestic MMFs.
...
In discussing the outlook for monetary policy, participants anticipated that if the data came in about as expected, with inflation continuing to move down sustainably to 2 percent and the economy remaining near maximum employment, it would likely be appropriate to move gradually toward a more neutral stance of policy over time. Participants noted that monetary policy decisions were not on a preset course and were conditional on the evolution of the economy and the implications for the economic outlook and the balance of risks; they stressed that it would be important for the Committee to make this clear as it adjusted its policy stance. While emphasizing that monetary policy would be data dependent, many participants noted the volatility of recent economic data and highlighted the importance of focusing on underlying economic trends and the evolution of the outlook when assessing incoming information. Some participants remarked that, at a future meeting, there would be value in the Committee considering a technical adjustment to the rate offered at the ON RRP facility to set the rate equal to the bottom of the target range for the federal funds rate, thereby bringing the rate back into an alignment that had existed when the facility was established as a monetary policy tool.
emphasis added
New Home Sales Decrease Sharply to 610,000 Annual Rate in October
by Calculated Risk on 11/26/2024 10:48:00 AM
Today, in the Calculated Risk Real Estate Newsletter: New Home Sales Decrease Sharply to 610,000 Annual Rate in October
Brief excerpt:
Important: Sales in October were impacted by the hurricanes. The south region was down 27.7% year-over-year (“South” includes Florida, the Carolinas and Georgia - states hit hardest by hurricanes Helene and Milton). Excluding the South, sales were up about 8% year-over-year.There is much more in the article.
The Census Bureau reported New Home Sales in October were at a seasonally adjusted annual rate (SAAR) of 610 thousand. The previous three months were revised down, combined.
...
The next graph shows new home sales for 2023 and 2024 by month (Seasonally Adjusted Annual Rate). Sales in October 2024 were down 9.4% from October 2023.
New home sales, seasonally adjusted, have increased year-over-year in 17 of the last 19 months.

New Home Sales Decrease Sharply to 610,000 Annual Rate in October
by Calculated Risk on 11/26/2024 10:00:00 AM
The Census Bureau reports New Home Sales in October were at a seasonally adjusted annual rate (SAAR) of 610 thousand.
The previous three months were revised down, combined.
Sales of new single-family houses in October 2024 were at a seasonally adjusted annual rate of 610,000, according to estimates released jointly today by the U.S. Census Bureau and the Department of Housing and Urban Development. This is 17.3 percent below the revised September rate of 738,000 and is 9.4 percent below the October 2023 estimate of 673,000.
emphasis added
 Click on graph for larger image.
The first graph shows New Home Sales vs. recessions since 1963. The dashed line is the current sales rate.
New home sales were below pre-pandemic levels.
The second graph shows New Home Months of Supply.
 The months of supply increased in October to 9.5 months from 7.7 months in September.
 The all-time record high was 12.2 months of supply in January 2009. The all-time record low was 3.3 months in August 2020.
This is well above the top of the normal range (about 4 to 6 months of supply is normal).
"The seasonally-adjusted estimate of new houses for sale at the end of October was 481,000. This represents a supply of 9.5 months at the current sales rate."Sales were well below expectations of 730 thousand SAAR, and sales for the three previous months were revised down, combined. I'll have more later today.
Case-Shiller: National House Price Index Up 3.9% year-over-year in September
by Calculated Risk on 11/26/2024 09:46:00 AM
Today, in the Calculated Risk Real Estate Newsletter: Case-Shiller: National House Price Index Up 3.9% year-over-year in September
Excerpt:
S&P/Case-Shiller released the monthly Home Price Indices for September ("September" is a 3-month average of July, August and September closing prices). September closing prices include some contracts signed in May, so there is a significant lag to this data. Here is a graph of the month-over-month (MoM) change in the Case-Shiller National Index Seasonally Adjusted (SA).
The MoM increase in the seasonally adjusted (SA) Case-Shiller National Index was at 0.33% (a 4.1% annual rate), This was the 20th consecutive MoM increase in the seasonally adjusted index.
On a seasonally adjusted basis, prices increased month-to-month in 18 of the 20 Case-Shiller cities (prices declined in Los Angeles and Miami). Seasonally adjusted). San Francisco has fallen 6.8% from the recent peak, Phoenix is down 3.5% from the peak, and Denver down 2.5%.

Case-Shiller: National House Price Index Up 3.9% year-over-year in September
by Calculated Risk on 11/26/2024 09:00:00 AM
S&P/Case-Shiller released the monthly Home Price Indices for September ("September" is a 3-month average of July, August and September closing prices).
This release includes prices for 20 individual cities, two composite indices (for 10 cities and 20 cities) and the monthly National index.
From S&P S&P CoreLogic Case-Shiller Index Records 3.9% Annual Gain in September 2024
The S&P CoreLogic Case-Shiller U.S. National Home Price NSA Index, covering all nine U.S. census divisions, reported a 3.9% annual return for September, down from a 4.3% annual gain in the previous month. The 10-City Composite saw an annual increase of 5.2%, down from a 6.0% annual increase in the previous month. The 20-City Composite posted a year-over-year increase of 4.6%, dropping from a 5.2% increase in the previous month. New York again reported the highest annual gain among the 20 cities with a 7.5% increase in September, followed by Cleveland and Chicago with annual increases of 7.1% and 6.9%, respectively. Denver posted the smallest year-over-year growth with 0.2%.
...
The pre-seasonally adjusted U.S. National Index, 20-City Composite, and 10-City Composite upward trends continued to reverse in September, with a -0.1% drop for the national index, and the 20-City and 10-City Composites saw -0.3% and -0.4% returns for this month, respectively.
After seasonal adjustment, the U.S. National Index posted a month-over-month increase of 0.3%, while the 20-City and 10-City Composite reported monthly rises of 0.2% and 0.1%, respectively.
“Home price growth stalled in the third quarter, after a steady start to 2024,” says Brian D. Luke, CFA, Head of Commodities, Real & Digital Assets. “The slight downtick could be attributed to technical factors as the seasonally adjusted figures boasted a 16th consecutive all-time high.
“We continue to see above-trend price growth in the Northeast and Midwest, growing 5.7% and 5.4%, respectively, led by New York, Cleveland, and Chicago,” Luke continued. “The Big Apple has taken the top spot for five consecutive months, pushing the region ahead of all others since August 2023. The South region reported its slowest growth in over a year, rising 2.8%, barely above current inflation levels.”
emphasis added
 Click on graph for larger image.
 The first graph shows the nominal seasonally adjusted Composite 10, Composite 20 and National indices (the Composite 20 was started in January 2000).
The Composite 10 index was up 0.1% in September (SA). The Composite 20 index was up 0.2% (SA) in September.
The National index was up 0.3% (SA) in September.
The second graph shows the year-over-year change in all three indices.The Composite 10 SA was up 5.2% year-over-year. The Composite 20 SA was up 4.6% year-over-year.
The National index SA was up 3.9% year-over-year.
Annual price changes were close to expectations. I'll have more later.
Monday, November 25, 2024
Tuesday: Case-Shiller House Prices, New Home Sales, FOMC Minutes and More
by Calculated Risk on 11/25/2024 07:16:00 PM
 From Matthew Graham at Mortgage News Daily: Mortgage Rates Near Lowest Levels in a Month
Last Monday, mortgage rates were near the highest levels in more than 3 months. A week later, and the average lender is right in line with the lowest levels in more than a month.Tuesday:
...
The average top tier 30yr fixed mortgage rate fell back below 7% with today's move, but not by much. This means many borrowers will still be seeing rates in the low 7s, even for top tier scenarios. [30 year fixed 6.93%]
emphasis added
• At 9:00 AM ET, S&P/Case-Shiller House Price Index for September. The National index was up 4.2% YoY in August and is expected to increase about the same in September.
• Also at 9:00 AM, FHFA House Price Index for September. This was originally a GSE only repeat sales, however there is also an expanded index. The Conforming loan limits for next year will also be announced.
• At 10:00 AM, New Home Sales for October from the Census Bureau. The consensus is for 730 thousand SAAR, down from 738 thousand in September.
• Also at 10:00 AM, Richmond Fed Survey of Manufacturing Activity for November. This is the last of the regional Fed manufacturing surveys for November.
• At 2:00 PM, FOMC Minutes, Minutes Meeting of November 6-7, 2024
Housing Nov 25th Weekly Update: Inventory down 0.4% Week-over-week, Up 27.1% Year-over-year
by Calculated Risk on 11/25/2024 04:02:00 PM
Altos reports that active single-family inventory was down 0.4% week-over-week. Inventory is now 2.8% below the peak for the year (5 weeks ago).
Inventory will now decline seasonally until early next year.
The first graph shows the seasonal pattern for active single-family inventory since 2015.
 Click on graph for larger image.
The red line is for 2024. The black line is for 2019.
Inventory was up 27.1% compared to the same week in 2023 (last week it was up 26.7%), and down 17.5% compared to the same week in 2019 (last week it was down 18.5%).
Back in June 2023, inventory was down almost 54% compared to 2019, so the gap to more normal inventory levels is about two-thirds closed.
 This second inventory graph is courtesy of Altos Research.
As of Nov 22nd, inventory was at 719 thousand (7-day average), compared to 722 thousand the prior week.
Mike Simonsen discusses this data regularly on Youtube.
Final Look at Local Housing Markets in October and a Look Ahead to November Sales
by Calculated Risk on 11/25/2024 01:51:00 PM
Today, in the Calculated Risk Real Estate Newsletter: Final Look at Local Housing Markets in October and a Look Ahead to November Sales
A brief excerpt:
After the National Association of Realtors® (NAR) releases the monthly existing home sales report, I pick up additional local market data that is reported after the NAR. This is the final look at local markets in October.There is much more in the article.
The big story for October was that existing home sales increased year-over-year (YoY) for the first time since July 2021. However, sales in October, at 3.96 million on a seasonally adjusted annual rate basis (SAAR) were still historically low. This YoY increase was a combination of weak sales in October 2023 and lower mortgage rates in August and September when contracts were signed (Existing home sales are reported at closing). The mortgage rates in August, September and October were the lowest mortgage rates in 2 years!
Also, regionally, inventory continues to increase sharply in Florida and Texas.
...
Here is a look at months-of-supply using NSA sales. Note the regional differences, especially in Florida and Texas (although October statistics in Florida were impacted by Hurricane Milton). This pickup in inventory is impacting prices in Florida.
...
Many more local markets to come!

"The Financial Stability Implications of Digital Assets"
by Calculated Risk on 11/25/2024 09:50:00 AM
An interesting paper from researchers at the NY Fed: The Financial Stability Implications of Digital Assets Here is the overview:
• This article considers the potential vulnerabilities associated with the digital asset ecosystem, adapting the Federal Reserve’s framework for assessing financial stability risks in the traditional financial system.Many years ago, after the financial crisis, I warned "Each new generation of ... wizards figures out a new way to turn lead into gold, and to become wealthy while damaging the financial system. Some of these wizards are probably perfecting their financial alchemy right now."
• In particular, it examines the potential channels through which stress in crypto-asset markets could be transmitted to the traditional financial system and ultimately disrupt the real economy.
• The authors argue that, to date, the contribution of digital assets to systemic risk has been limited, given that the digital ecosystem is relatively small and not a major provider of financing and payment services to the real economy.
• However, the observed fragility in the digital asset space is associated with vulnerabilities that could destabilize the broader financial system if the digital ecosystem becomes more systemic
emphasis added
Sunday, November 24, 2024
Sunday Night Futures
by Calculated Risk on 11/24/2024 08:01:00 PM
Weekend:
• Schedule for Week of November 24, 2024
Monday:
• At 8:30 AM ET, Chicago Fed National Activity Index for October. This is a composite index of other data.
• At 10:30 AM, Dallas Fed Survey of Manufacturing Activity for November.
From CNBC: Pre-Market Data and Bloomberg futures S&P 500 areup 25 and DOW futures are up 232 (fair value).
Oil prices were up over the last week with WTI futures at $71.24 per barrel and Brent at $75.17 per barrel. A year ago, WTI was at $75, and Brent was at $80 - so WTI oil prices are down about 5% year-over-year.
Here is a graph from Gasbuddy.com for nationwide gasoline prices. Nationally prices are at $3.03 per gallon. A year ago, prices were at $3.24 per gallon, so gasoline prices are down $0.21 year-over-year.
Hotels: Occupancy Rate Decreased 3.5% Year-over-year
by Calculated Risk on 11/24/2024 08:21:00 AM
Due to the Veteran’s Day calendar shift, the U.S. hotel industry reported mixed year-over-year performance comparisons, according to CoStar’s latest data through 16 November. ...The following graph shows the seasonal pattern for the hotel occupancy rate using the four-week average.
10-16 November 2024 (percentage change from comparable week in 2023):
• Occupancy: 63.3% (+1.5%)
• Average daily rate (ADR): US$154.96 (-1.1%)
• Revenue per available room (RevPAR): US$98.11 (+0.4%)
emphasis added
 Click on graph for larger image.
The red line is for 2024, blue is the median, and dashed light blue is for 2023. Dashed purple is for 2018, the record year for hotel occupancy.
The 4-week average of the occupancy rate is above both last year and the median rate for the period 2000 through 2023 (Blue) - and will likely finish mostly unchanged year-over-year.
Note: Y-axis doesn't start at zero to better show the seasonal change.
The 4-week average of the occupancy rate has peaked for the fall business travel season and will decline seasonally through the holidays.
Saturday, November 23, 2024
Real Estate Newsletter Articles this Week: Existing-Home Sales Increased to 3.96 million SAAR in October
by Calculated Risk on 11/23/2024 02:11:00 PM
At the Calculated Risk Real Estate Newsletter this week:
 Click on graph for larger image.
• NAR: Existing-Home Sales Increased to 3.96 million SAAR in October
• Housing Starts Decreased to 1.311 million Annual Rate in October
• Preliminary 2025 Housing Forecasts
• California Home Sales Up 9.5% SA YoY in October
• 3rd Look at Local Housing Markets in October
This is usually published 4 to 6 times a week and provides more in-depth analysis of the housing market.
Schedule for Week of November 24, 2024
by Calculated Risk on 11/23/2024 08:11:00 AM
The key reports this week include the 2nd estimate of Q3 GDP and October New Home Sales.
Other key indicators include the September Case-Shiller and FHFA house price indexes, and October Personal Income & Outlays (and PCE).
----- Monday, November 25th -----
8:30 AM ET: Chicago Fed National Activity Index for October. This is a composite index of other data.
10:30 AM: Dallas Fed Survey of Manufacturing Activity for November.
----- Tuesday, November 26th -----
 9:00 AM ET: S&P/Case-Shiller House Price Index for September.
This graph shows graph shows the Year over year change in the seasonally adjusted National Index, Composite 10 and Composite 20 indexes through the most recent report (the Composite 20 was started in January 2000).
The National index was up 4.2% YoY in August and is expected to increase about the same in September.
9:00 AM: FHFA House Price Index for September. This was originally a GSE only repeat sales, however there is also an expanded index. The Conforming loan limits for next year will also be announced.
 10:00 AM: New Home Sales for October from the Census Bureau.
This graph shows New Home Sales since 1963. The dashed line is the sales rate for last month.
The consensus is for 730 thousand SAAR, down from 738 thousand in September.
10:00 AM: Richmond Fed Survey of Manufacturing Activity for November. This is the last of the regional Fed manufacturing surveys for November.
2:00 PM: FOMC Minutes, Minutes Meeting of November 6-7, 2024
----- Wednesday, November 27th -----
7:00 AM ET: The Mortgage Bankers Association (MBA) will release the results for the mortgage purchase applications index.
8:30 AM: The initial weekly unemployment claims report will be released. The consensus is for 220 thousand initial claims, up from 213 thousand last week.
8:30 AM: Gross Domestic Product (Second Estimate) and Corporate Profits (Preliminary), 3rd Quarter 2024. The consensus is that real GDP increased 2.8% annualized in Q3, unchanged from the advance estimate of 2.8% in Q3.
8:30 AM: Durable Goods Orders for October from the Census Bureau. The consensus is for a 0.1% increase in durable goods orders.
9:45 AM: Chicago Purchasing Managers Index for November.
10:00 AM: Personal Income and Outlays, October 2024. The consensus is for a 0.3% increase in personal income, and for a 0.4% increase in personal spending. And for the Core PCE price index to increase 0.3%. PCE prices are expected to be up 2.1% YoY, and core PCE prices up 2.7% YoY.
10:00 AM: Pending Home Sales Index for October.
----- Thursday, November 28th -----
All US markets will be closed in observance of the Thanksgiving Day Holiday.
----- Friday, November 29th -----
The NYSE and the NASDAQ will close early at 1:00 PM ET.
8:30 AM ET: Chicago Fed National Activity Index for October. This is a composite index of other data.
10:30 AM: Dallas Fed Survey of Manufacturing Activity for November.
 9:00 AM ET: S&P/Case-Shiller House Price Index for September.
This graph shows graph shows the Year over year change in the seasonally adjusted National Index, Composite 10 and Composite 20 indexes through the most recent report (the Composite 20 was started in January 2000).
The National index was up 4.2% YoY in August and is expected to increase about the same in September.
9:00 AM: FHFA House Price Index for September. This was originally a GSE only repeat sales, however there is also an expanded index. The Conforming loan limits for next year will also be announced.
 10:00 AM: New Home Sales for October from the Census Bureau.
 This graph shows New Home Sales since 1963. The dashed line is the sales rate for last month.
The consensus is for 730 thousand SAAR, down from 738 thousand in September.
10:00 AM: Richmond Fed Survey of Manufacturing Activity for November. This is the last of the regional Fed manufacturing surveys for November.
2:00 PM: FOMC Minutes, Minutes Meeting of November 6-7, 2024
7:00 AM ET: The Mortgage Bankers Association (MBA) will release the results for the mortgage purchase applications index.
8:30 AM: The initial weekly unemployment claims report will be released. The consensus is for 220 thousand initial claims, up from 213 thousand last week.
8:30 AM: Gross Domestic Product (Second Estimate) and Corporate Profits (Preliminary), 3rd Quarter 2024. The consensus is that real GDP increased 2.8% annualized in Q3, unchanged from the advance estimate of 2.8% in Q3.
8:30 AM: Durable Goods Orders for October from the Census Bureau. The consensus is for a 0.1% increase in durable goods orders.
9:45 AM: Chicago Purchasing Managers Index for November.
10:00 AM: Personal Income and Outlays, October 2024. The consensus is for a 0.3% increase in personal income, and for a 0.4% increase in personal spending. And for the Core PCE price index to increase 0.3%. PCE prices are expected to be up 2.1% YoY, and core PCE prices up 2.7% YoY.
10:00 AM: Pending Home Sales Index for October.
All US markets will be closed in observance of the Thanksgiving Day Holiday.
The NYSE and the NASDAQ will close early at 1:00 PM ET.
Friday, November 22, 2024
November 22nd COVID Update: COVID in Wastewater Continues to Decline
by Calculated Risk on 11/22/2024 07:11:00 PM
 Note: Mortgage rates are from MortgageNewsDaily.com and are for top tier scenarios.
For deaths, I'm currently using 4 weeks ago for "now", since the most recent three weeks will be revised significantly.
Note: "Effective May 1, 2024, hospitals are no longer required to report COVID-19 hospital admissions, hospital capacity, or hospital occupancy data." So I'm no longer tracking hospitalizations.
| COVID Metrics | ||||
|---|---|---|---|---|
| Now | Week Ago | Goal | ||
| Deaths per Week | 597 | 703 | ≤3501 | |
| 1my goals to stop weekly posts, 🚩 Increasing number weekly for Deaths ✅ Goal met. | ||||
 Click on graph for larger image.
This graph shows the weekly (columns) number of deaths reported.
Although weekly deaths met the original goal to stop posting, I'm continuing to post now that deaths are above the goal again.
Weekly deaths are now declining and will likely continue to decline based on wastewater sampling but are still almost double the low of 302 in early June.
 This appears to be a leading indicator for COVID hospitalizations and deaths.
COVID in wastewater is fairly low - only about 18% higher than the lows of last May - suggesting weekly deaths will continue to decline.
November Vehicle Sales Forecast: 16.2 million SAAR, Up 5% YoY
by Calculated Risk on 11/22/2024 05:18:00 PM
From WardsAuto: November U.S. Light-Vehicle Sales to Improve on October’s Growth (pay content). Brief excerpt:
November’s forecast SAAR of 16.2 million units is the highest since May 2021. With the month having an atypical fifth weekend, the extended timeframe means there is more upside than downside to November’s forecast – especially with retail volume already showing solid growth.
emphasis added
 Click on graph for larger image.
This graph shows actual sales from the BEA (Blue), and Wards forecast for November (Red).
On a seasonally adjusted annual rate basis, the Wards forecast of 16.2 million SAAR, would be up 1.0% from last month, and up 4.8% from a year ago.
Q4 GDP Tracking: Mid 2% Range
by Calculated Risk on 11/22/2024 12:34:00 PM
From Goldman:
We left our Q4 GDP tracking estimate unchanged at +2.4% (quarter-over-quarter annualized) but boosted our Q4 domestic final sales forecast by 0.1pp to +2.0%. Our Q3 past-quarter tracking estimate stands at +2.9% (vs. 2.8% originally reported, quarter-over-quarter annualized). [Nov 21st estimate]And from the Atlanta Fed: GDPNow
emphasis added
The GDPNow model estimate for real GDP growth (seasonally adjusted annual rate) in the fourth quarter of 2024 is 2.6 percent on November 19, up from 2.5 percent on November 15. After this morning's housing starts report from the US Census Bureau, the nowcast of fourth-quarter real residential fixed investment growth increased from -1.2 percent to 0.1 percent. [Nov 19th estimate]
Preliminary 2025 Housing Forecasts
by Calculated Risk on 11/22/2024 10:18:00 AM
Today, in the CalculatedRisk Real Estate Newsletter: Preliminary 2025 Housing Forecasts
Excerpt:
Towards the end of each year, I collect some housing forecasts for the following year - and also provide my own outlook. Several more forecast will be available in early December.
...
The table below shows several early forecasts for 2025:
A few points from these early forecasts:
1. Forecasters expect house prices to increase next year in the low-to-mid single digits.
2. Everyone expects multi-family starts to stay depressed in 2025.
3. Everyone expects both new and existing home sales to increase in 2025, although existing home sales are expected to remain in the low 4 million range.

How many people work for the U.S. federal government?
by Calculated Risk on 11/22/2024 08:11:00 AM
The new administration is talking about cutting the number of federal government employees.
This raises the question of how many people are employed by the Federal government?
The following data is from the BLS and does not include military personnel.
The first graph shows total government employment (Federal, State and Local).
 Click on graph for larger image.
First, most government employees are local (police officers, fire department, etc), followed by state employees. There are almost 15 million local government employees and 5.5 million state government employees.
Approximately half of the state and local employees work in education (teachers!)
The Federal government has about 3.0 million employees. Note that the spikes in Federal employment are for decennial Census.
 The second graph shows total Federal employees, and Federal employees excluding postal workers since 1960.
Once again, the spikes are the decennial Census!
Currently there are just over 600 thousand postal workers, and just under 2.4 million other federal employees.
The Federal government has outsourced some functions to the private sector.
 The third graph shows Federal employment as a percent of total employment.
Federal employment was around 4.3% of total employment in 1960 and is now down to 1.9%.
Just some numbers and graphs to keep in mind during the discussion of federal employment cuts.
Thursday, November 21, 2024
Friday: No Major Economic Releases
by Calculated Risk on 11/21/2024 09:13:00 PM
 Note: Mortgage rates are from MortgageNewsDaily.com and are for top tier scenarios.
Friday:
• At 10:00 AM ET, University of Michigan's Consumer sentiment index (Final for November).
Realtor.com Reports Active Inventory Up 25.9% YoY
by Calculated Risk on 11/21/2024 05:25:00 PM
What this means: On a weekly basis, Realtor.com reports the year-over-year change in active inventory and new listings. On a monthly basis, they report total inventory. For September, Realtor.com reported inventory was up 29.2% YoY, but still down 21.1% compared to the 2017 to 2019 same month levels.
Now - on a weekly basis - inventory is up 25.9% YoY.
Realtor.com has monthly and weekly data on the existing home market. Here is their weekly report: Weekly Housing Trends View—Data for Week Ending Nov. 16, 2024 Here is a graph of the year-over-year change in inventory according to realtor.com.
Inventory was up year-over-year for the 54th consecutive week.
Realtor.com has monthly and weekly data on the existing home market. Here is their weekly report: Weekly Housing Trends View—Data for Week Ending Nov. 16, 2024
• Active inventory increased, with for-sale homes 25.9% above year-ago levels
For the 54th consecutive week, the number of homes for sale has increased compared with the same time last year. However, this week’s growth was smaller than last week’s, marking the eighth consecutive week of deceleration and the smallest annual increase since late March.
• New listings—a measure of sellers putting homes up for sale—climbed 3.5% this week compared with one year ago
The number of newly listed homes saw a slight uptick compared with the same week last year, offering a glimmer of hope for buyers seeking fresh inventory. However, the recent climb in mortgage rates might deter many potential sellers from entering the market, particularly those locked into lower rates who are hesitant to trade up to higher borrowing costs.
 Here is a graph of the year-over-year change in inventory according to realtor.com.
 Inventory was up year-over-year for the 54th consecutive week.
However, inventory is still historically low.
New listings remain below typical pre-pandemic levels.
ICE: Mortgage Delinquency Rate Increased Year-over-year in October
by Calculated Risk on 11/21/2024 02:15:00 PM
• At 3.45% in October, the national delinquency rate was up 6% from the same time last year, marking five consecutive months of year-over-year increases
• While 30- & 60-day delinquencies decreased from September, seriously past due loans (90+ days) continued their slow rise, now up 7.3% from last year and at the highest level since May 2023
• Though both foreclosure starts (+12.2%) and completions (+10.1%) were up in October, both remain down from last year (-12.3% and -9.5%, respectively) and well below pre-pandemic levels
• Likewise, foreclosure inventory was up a modest +1K in the month, but there are 28K fewer loans in active foreclosure than there were at this same time last year
• Prepayment activity rose on easing interest rates to a level not seen in over two years (May 2022) and nearly double where it was last October
emphasis added
 Click on graph for larger image.
Here is a table from ICE.
NAR: Existing-Home Sales Increased to 3.96 million SAAR in October
by Calculated Risk on 11/21/2024 10:51:00 AM
Today, in the CalculatedRisk Real Estate Newsletter: NAR: Existing-Home Sales Increased to 3.96 million SAAR in October
Excerpt:
As expected, existing home sales were up year-over-year for the first time since 2021. This was a combination of weak sales in October last year and lower mortgage rates in August and September when contracts were signed (Existing home sales are reported at closing).
...
The sales rate was above the consensus forecast (but at housing economist Tom Lawler’s estimate).
...
Sales Year-over-Year and Not Seasonally Adjusted (NSA)
The fourth graph shows existing home sales by month for 2023 and 2024.
Sales increased 2.9% year-over-year compared to October 2023. This was the first year-over-year increase since July 2021.

NAR: Existing-Home Sales Increased to 3.96 million SAAR in October
by Calculated Risk on 11/21/2024 10:00:00 AM
From the NAR: Existing-Home Sales Grew 3.4% in October; First Year-Over-Year Gain Since July 2021
Existing-home sales rose in October, according to the National Association of REALTORS®. Sales improved in all four major U.S. regions. Year-over-year, sales elevated in three regions but were unchanged in the Northeast.
Total existing-home sales – completed transactions that include single-family homes, townhomes, condominiums and co-ops – expanded 3.4% from September to a seasonally adjusted annual rate of 3.96 million in October. Year-over-year, sales progressed 2.9% (up from 3.85 million in October 2023).
...
Total housing inventory registered at the end of October was 1.37 million units, up 0.7% from September and 19.1% from one year ago (1.15 million). Unsold inventory sits at a 4.2-month supply at the current sales pace, down from 4.3 months in September but up from 3.6 months in October 2023.
emphasis added
Click on graph for larger image.This graph shows existing home sales, on a Seasonally Adjusted Annual Rate (SAAR) basis since 1994.
Sales in October (3.96 million SAAR) were up 3.4% from the previous month and were 2.9% above the October 2023 sales rate. This was the first year-over-year increase since July 2021.
The second graph shows nationwide inventory for existing homes.
 According to the NAR, inventory increased to 1.37 million in October from 1.36 million the previous month.
 According to the NAR, inventory increased to 1.37 million in October from 1.36 million the previous month.
Headline inventory is not seasonally adjusted, and inventory usually decreases to the seasonal lows in December and January, and peaks in mid-to-late summer.
The last graph shows the year-over-year (YoY) change in reported existing home inventory and months-of-supply. Since inventory is not seasonally adjusted, it really helps to look at the YoY change. Note: Months-of-supply is based on the seasonally adjusted sales and not seasonally adjusted inventory.
 Inventory was up 19.1% year-over-year (blue) in October compared to October 2023.
Months of supply (red) decreased to 4.2 months in October from 4.3 months the previous month.
The sales rate was above the consensus forecast. I'll have more later.
The last graph shows the year-over-year (YoY) change in reported existing home inventory and months-of-supply. Since inventory is not seasonally adjusted, it really helps to look at the YoY change. Note: Months-of-supply is based on the seasonally adjusted sales and not seasonally adjusted inventory.
 Inventory was up 19.1% year-over-year (blue) in October compared to October 2023.
 Months of supply (red) decreased to 4.2 months in October from 4.3 months the previous month.
The sales rate was above the consensus forecast. I'll have more later.
Weekly Initial Unemployment Claims Decrease to 213,000
by Calculated Risk on 11/21/2024 08:30:00 AM
The DOL reported:
In the week ending November 16, the advance figure for seasonally adjusted initial claims was 213,000, a decrease of 6,000 from the previous week's revised level. The previous week's level was revised up by 2,000 from 217,000 to 219,000. The 4-week moving average was 217,750, a decrease of 3,750 from the previous week's revised average. The previous week's average was revised up by 500 from 221,000 to 221,500.The following graph shows the 4-week moving average of weekly claims since 1971.
emphasis added
 Click on graph for larger image.
The dashed line on the graph is the current 4-week average. The four-week average of weekly unemployment claims decreased to 217,750.
The previous week was revised up.
Weekly claims were below the consensus forecast.

In Memoriam: Doris "Tanta" Dungey


| Privacy Policy |
| Copyright © 2007 - 2025 CR4RE LLC |
| Excerpts NOT allowed on x.com |