 RSS Feed
 by Calculated Risk on 3/10/2024 08:21:00 AM
Sunday, March 10, 2024
Realtor.com Reports Active Inventory UP 19.9% YoY; New Listings up 17.4% YoY
What this means: On a weekly basis, Realtor.com reports the year-over-year change in active inventory and new listings. On a monthly basis, they report total inventory. For February, Realtor.com reported inventory was up 14.8% YoY, but still down almost 40% compared to February 2019.
Now - on a weekly basis - inventory is up 19.9% YoY, and that would still put inventory down about 38% compared to March 2019.
Realtor.com has monthly and weekly data on the existing home market. Here is their weekly report: Weekly Housing Trends View — Data Week Ending March 2, 2024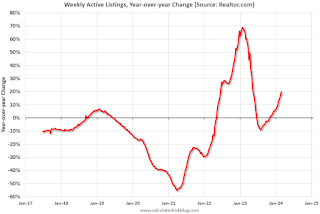 Here is a graph of the year-over-year change in inventory according to realtor.com.
Inventory was up year-over-year for the 17th consecutive week following 20 consecutive weeks with a YoY decrease in inventory.
Realtor.com has monthly and weekly data on the existing home market. Here is their weekly report: Weekly Housing Trends View — Data Week Ending March 2, 2024
• Active inventory increased, with for-sale homes 19.9% above year ago levels. For a 17th straight week, active listings registered above prior year level, which means that today’s home shoppers see more for-sale homes. In fact, the February Realtor.com Housing Trends Report showed that 2024 had the most abundant level of inventory since 2020, and inventory held relatively steady relative to January, counter to typical monthly trend over the last four years. Nevertheless, the number of homes on the market is still down nearly 40% compared to what was typical in 2017 to 2019.;
• New listings–a measure of sellers putting homes up for sale–were up this week, by 17.4% from one year ago. Newly listed homes reached above year ago levels for the 19th week in a row.
 Here is a graph of the year-over-year change in inventory according to realtor.com.
 Inventory was up year-over-year for the 17th consecutive week following 20 consecutive weeks with a YoY decrease in inventory.
Inventory is still historically very low.
Although new listings remain well below "typical pre-pandemic levels", new listings are now up YoY for the 19th consecutive week.


