 RSS Feed
 by Calculated Risk on 1/22/2024 11:21:00 AM
Monday, January 22, 2024
Update on High Frequency Indicators: Airlines and Movie Tickets
I stopped the weekly updates of high frequency indicators at the end of 2022.
Here is an early 2024 look at two indicators:
The TSA is providing daily travel numbers.
This data is as of January 21, 2024.
 Click on graph for larger image.
This data shows the 7-day average of daily total traveler throughput from the TSA for 2019 (Light Blue), 2020 (Black), 2021 (Blue), 2022 (Purple) and 2023 (Orange), and 2024 (Red).
The dashed line is the percent of 2019 for the seven-day average.
The 7-day average is above the level for the same week in 2019 (104.1% of 2019). (Dashed line)
Air travel - as a percent of 2019 - is tracking solidly above pre-pandemic levels.
----- Movie Tickets: Box Office Mojo -----
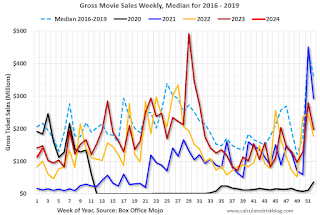 This data shows domestic box office for each week and the median for the years 2016 through 2019 (dashed light blue).
 This data shows domestic box office for each week and the median for the years 2016 through 2019 (dashed light blue).
 Black is 2020, Blue is 2021, Orange is 2022, Dark Red is 2024, and Red is 2024.
The data is from BoxOfficeMojo through January 18th.
Note that the data is usually noisy week-to-week and depends on when blockbusters are released.
Movie ticket sales (dollars) have mostly been running below the pre-pandemic levels.
Note that the data is usually noisy week-to-week and depends on when blockbusters are released.
Movie ticket sales (dollars) have mostly been running below the pre-pandemic levels.


