by Calculated Risk on 8/09/2023 04:06:00 PM
Wednesday, August 09, 2023
Oops. Wrong Graph Last Friday for 25- to 54-Years-Old Participation Rate
Last Friday I posted the incorrect chart for the 25 to 54 employment-population ratio and participation rate (ht Kevin). Here is the correct graph.
Prime (25 to 54 Years Old) Participation
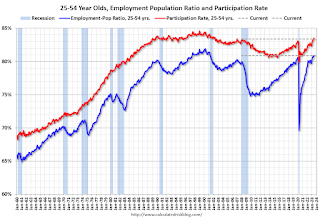
Since the overall participation rate is impacted by both cyclical (recession) and demographic (aging population, younger people staying in school) reasons, here is the employment-population ratio for the key working age group: 25 to 54 years old.
The 25 to 54 participation rate decreased in July to 83.4% from 83.5% in June, and the 25 to 54 employment population ratio was unchanged at 80.9% from 80.9% the previous month.
Both are above the pre-pandemic levels and suggest all of the prime age workers have returned to the labor force.
Last 10 Posts
- Jul 22 at 3:11 PM Update: Lumber Prices Up 30% YoY
- Jul 22 at 11:33 AM Fed Forecasts: No Cuts or Three Cuts in 2025?
- Jul 22 at 8:43 AM California Home Sales Down Slightly YoY in June
- Jul 21 at 7:44 PM Tuesday: Fed Chair Powell, Richmond Fed Mfg
- Jul 21 at 1:57 PM NMHC on Apartments: Market conditions Tightened in Q2
- Jul 21 at 10:22 AM Goldman's Mid-Year Housing Outlook
- Jul 21 at 8:11 AM Housing July 21st Weekly Update: Inventory up 1.2% Week-over-week; Down 11% from 2019 Levels
- Jul 20 at 6:21 PM Sunday Night Futures
- Jul 20 at 8:21 AM Realtor.com Reports Most Active "For Sale" Inventory since November 2019
- Jul 19 at 2:11 PM Real Estate Newsletter Articles this Week: Housing Starts Down 0.5% YoY in June
In Memoriam: Doris "Tanta" Dungey
Archive
Econbrowser
Pettis: China Financial Markets
NY Times Upshot
The Big Picture
Privacy Policy |
Copyright © 2007 - 2025 CR4RE LLC |
Excerpts NOT allowed on x.com |