 RSS Feed
 by Calculated Risk on 5/28/2023 10:32:00 AM
Sunday, May 28, 2023
Hotels: Occupancy Rate Down 1.5% Year-over-year
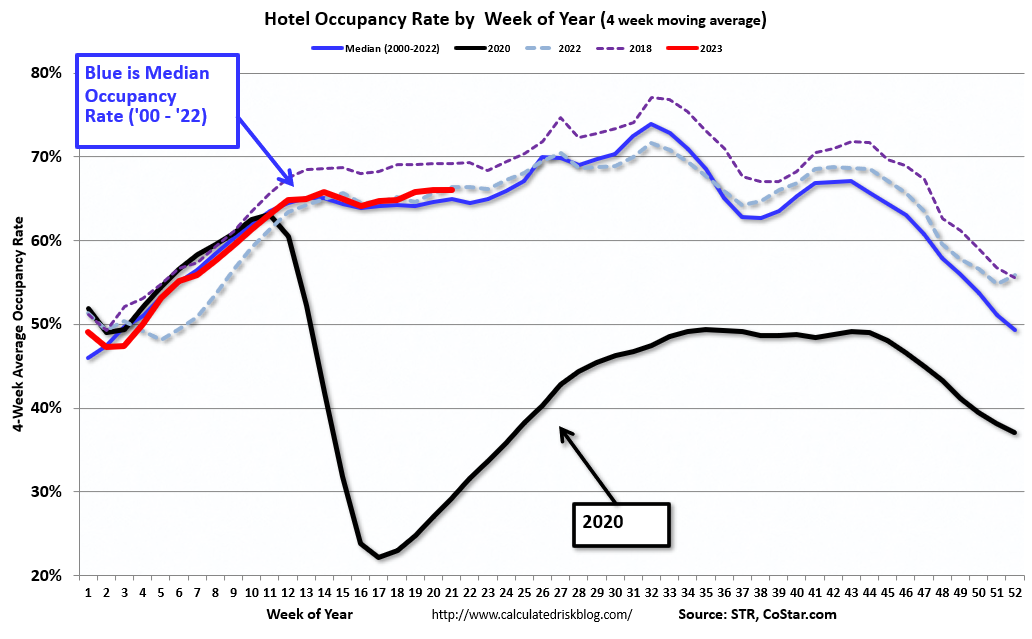
U.S. hotel performance increased from the previous week and showed improved comparisons year over year, according to STR‘s latest data through 20 May.The following graph shows the seasonal pattern for the hotel occupancy rate using the four-week average.
14-20 May 2023 (percentage change from comparable week in 2022):
• Occupancy: 67.5% (-1.5%)
• Average daily rate (ADR): US$158.53 (+3.6%)
• Revenue per available room (RevPAR): US$106.98 (+2.1%)
emphasis added
 Click on graph for larger image.
The red line is for 2023, black is 2020, blue is the median, and dashed light blue is for 2022. Dashed purple is for 2018, the record year for hotel occupancy.
The 4-week average of the occupancy rate is slightly above the median rate for the period 2000 through 2022 (Blue).
Note: Y-axis doesn't start at zero to better show the seasonal change.
The 4-week average of the occupancy rate will move mostly sideways for the next several weeks until the summer travel season.


