 RSS Feed
 by Calculated Risk on 9/12/2022 10:20:00 AM
Monday, September 12, 2022
Housing September 12th Update: Inventory Decreased 1.0% Last Week
Active inventory decreased 1.0% last week. Here are the same week inventory changes for the last four years (the increase in 2019 was a one-week surge):
2022: -5.4K
2021: -6.2K
2020: -5.0K
2019: +7.2K
Inventory bottomed seasonally at the beginning of March 2022 and is now up 127% since then. More than double! Altos reports inventory is up 26.9% year-over-year.
 Click on graph for larger image.
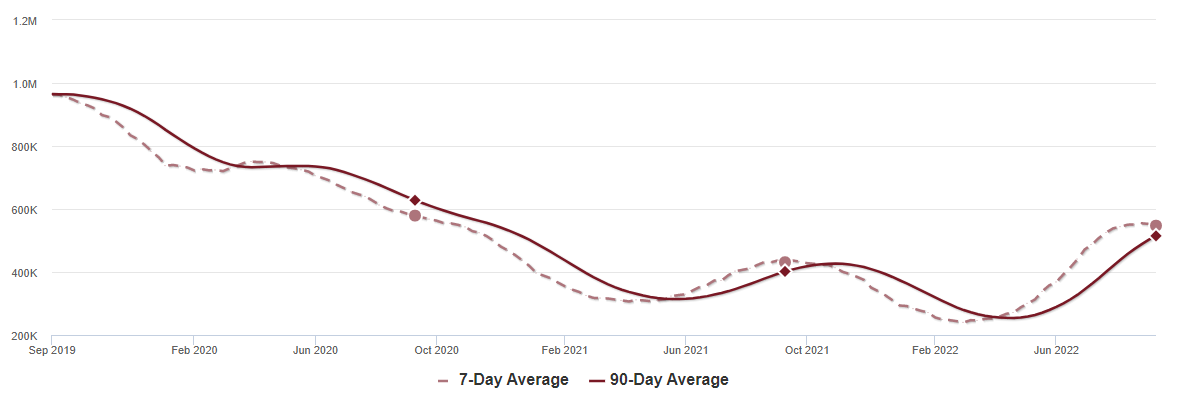
This inventory graph is courtesy of Altos Research.
 Click on graph for larger image.
This inventory graph is courtesy of Altos Research.
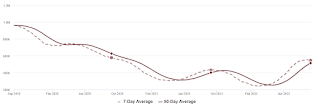
As of September 9th, inventory was at 547 thousand (7-day average), compared to 553 thousand the prior week. Inventory was down 1.0% from the previous week.
Inventory is still historically low. Compared to the same week in 2021, inventory is up 26.9% from 431 thousand, however compared to the same week in 2020 inventory is down 5.5% from 579 thousand. Compared to 3 years ago, inventory is down 43.2% from 964 thousand.
Here are the inventory milestones I’m watching for with the Altos data:
1. The seasonal bottom (happened on March 4th for Altos) ✅
2. Inventory up year-over-year (happened on May 13th for Altos) ✅
3. Inventory up compared to two years ago (currently down 5.5% according to Altos)
4. Inventory up compared to 2019 (currently down 43.2%).
1. The seasonal bottom (happened on March 4th for Altos) ✅
2. Inventory up year-over-year (happened on May 13th for Altos) ✅
3. Inventory up compared to two years ago (currently down 5.5% according to Altos)
4. Inventory up compared to 2019 (currently down 43.2%).
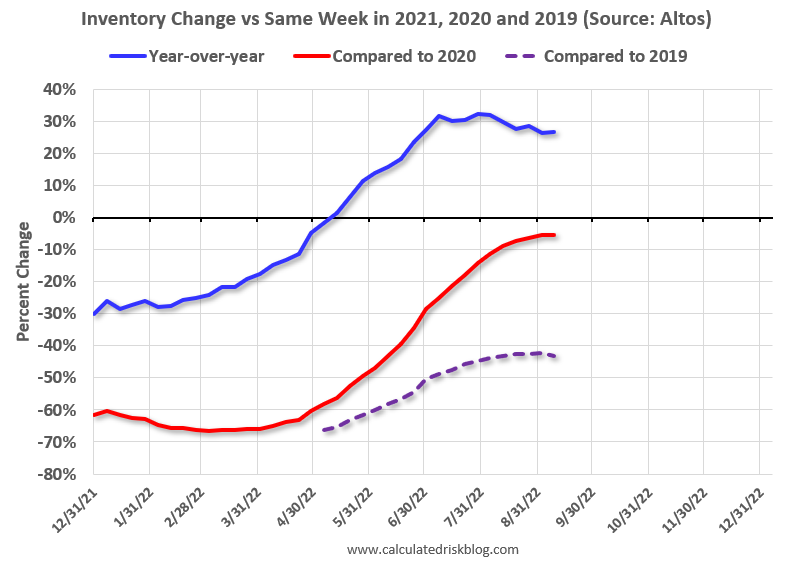
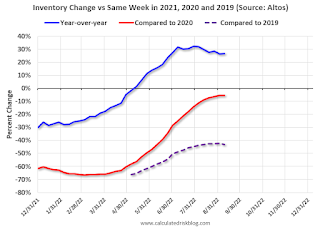
Here is a graph of the inventory change vs 2021, 2020 (milestone 3 above) and 2019 (milestone 4).
The blue line is the year-over-year data, the red line is compared to two years ago, and dashed purple is compared to 2019.
Two years ago (in 2020) inventory was declining all year, so the two-year comparison will get easier all year.
Based on the recent changes in inventory, my current estimate is inventory will be up compared to 2020 in Q4 of this year.
A key will be if inventory increases this month - so far inventory has decreased.
Mike Simonsen discusses this data regularly on Youtube.


