RSS Feed
 by Calculated Risk on 9/14/2022 11:20:00 AM
Wednesday, September 14, 2022
2nd Look at Local Housing Markets in August
Today, in the Calculated Risk Real Estate Newsletter: 2nd Look at Local Housing Markets in August
A brief excerpt:
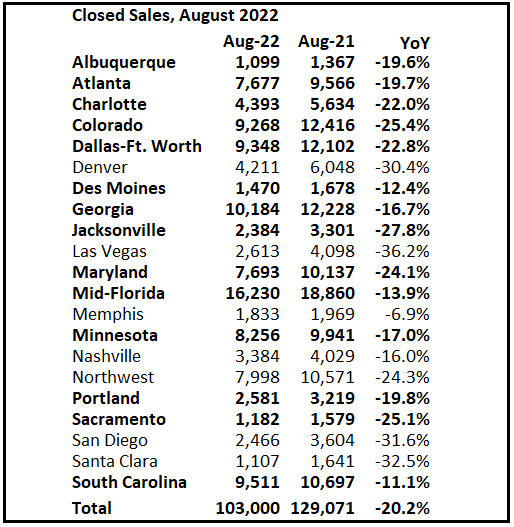
This is the second look at local markets in August. I’m tracking about 35 local housing markets in the US. Some of the 35 markets are states, and some are metropolitan areas. I’ll update these tables throughout the month as additional data is released.There is much more in the article. You can subscribe at https://calculatedrisk.substack.com/
The big story for August existing home sales is the sharp year-over-year (YoY) decline in sales. Another key story is that new listings are down YoY in August as the sellers’ strike continues. Of course, active listings are up sharply YoY, but inventory growth has stalled. The increase in inventory so far has been due to softer demand, likely because of higher mortgage rates.
In August, sales in these markets were down 20.2%.
Note that in August 2022, there was one more selling day than in August 2021, so the SA decline in August sales will be larger than the NSA decline.
The opposite was true in July (one more selling day in July 2021 than in July 2022). So, seasonally adjusted, this is probably close to the same YoY decline as in July.
Many more local markets to come!