 RSS Feed
 by Calculated Risk on 5/28/2022 08:11:00 AM
Saturday, May 28, 2022
Schedule for Week of May 29, 2022
The key report scheduled for this week is the May employment report.
Other key reports include the March Case-Shiller house prices, May ISM Manufacturing and Service surveys, and May Vehicle Sales.
All US markets will be closed in observance of Memorial Day.
 9:00 AM: S&P/Case-Shiller House Price Index for March.
This graph shows the year-over-year change in the seasonally adjusted National Index, Composite 10 and Composite 20 indexes through the most recent report (the Composite 20 was started in January 2000).
The consensus is for a 20.0% year-over-year increase in the Comp 20 index for March.
9:00 AM: FHFA House Price Index for March 2022. This was originally a GSE only repeat sales, however there is also an expanded index.
9:45 AM: Chicago Purchasing Managers Index for May.
10:00 AM: Dallas Fed Survey of Manufacturing Activity for May.
7:00 AM ET: The Mortgage Bankers Association (MBA) will release the results for the mortgage purchase applications index.
 10:00 AM ET: Job Openings and Labor Turnover Survey for April from the BLS.
 This graph shows job openings (yellow line), hires (purple), Layoff, Discharges and other (red column), and Quits (light blue column) from the JOLTS.
Jobs openings increased slightly in March to 11.549 million from 11.344 million in February. The number of job openings (yellow) were up 36% year-over-year.
10:00 AM: ISM Manufacturing Index for May. The consensus is for the ISM to be at 54.5, down from 55.4 in April.
10:00 AM: Construction Spending for April. The consensus is for a 0.5% increase in construction spending.
2:00 PM: the Federal Reserve Beige Book, an informal review by the Federal Reserve Banks of current economic conditions in their Districts.
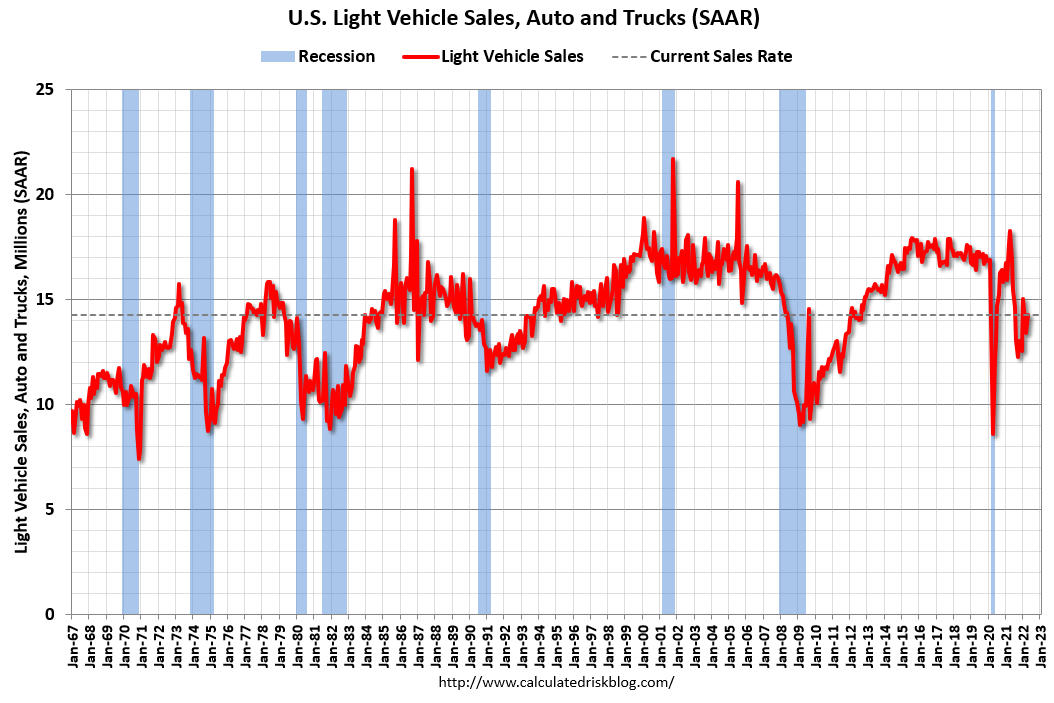 All day: Light vehicle sales for May. The consensus is for light vehicle sales to be 14.5 million SAAR in May, up from 14.3 million in April (Seasonally Adjusted Annual Rate).
Wards Auto is forecasting a decline in sales to 13.4 million SAAR.
This graph shows light vehicle sales since the BEA started keeping data in 1967. The dashed line is the sales rate for last month.
----- Thursday, June 2nd -----
8:15 AM: The ADP Employment Report for May. This report is for private payrolls only (no government). The consensus is for 280,000 payroll jobs added in May, up from 247,000 in April.
8:30 AM: The initial weekly unemployment claims report will be released. The consensus is for 210 thousand unchanged from 210 thousand last week.
----- Friday, June 3rd -----
 8:30 AM: Employment Report for May. The consensus is for 320,000 jobs added, and for the unemployment rate to decline to 3.5%.
There were 428,000 jobs added in April, and the unemployment rate was at 3.6%.
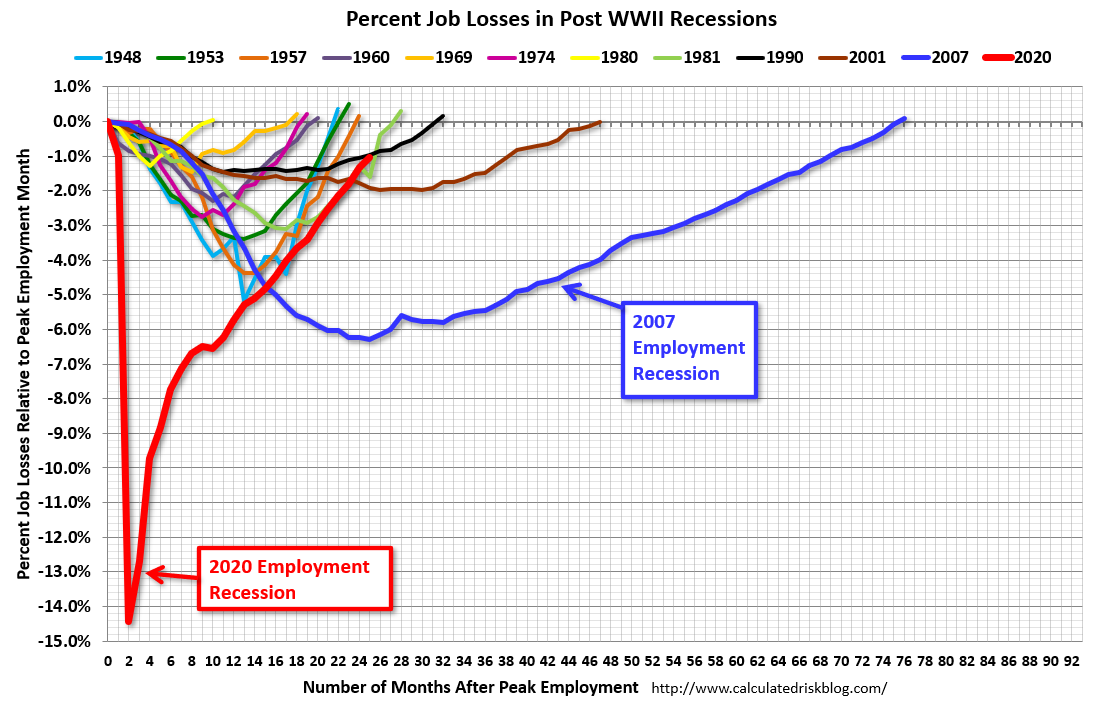
This graph shows the job losses from the start of the employment recession, in percentage terms.
The current employment recession was by far the worst recession since WWII in percentage terms. However, the current employment recession, 25 months after the onset, has recovered quicker than the previous two recessions.
10:00 AM: the ISM Services Index for May. The consensus is for a reading of 56.4, down from 57.1.
This graph shows light vehicle sales since the BEA started keeping data in 1967. The dashed line is the sales rate for last month.
8:15 AM: The ADP Employment Report for May. This report is for private payrolls only (no government). The consensus is for 280,000 payroll jobs added in May, up from 247,000 in April.
8:30 AM: The initial weekly unemployment claims report will be released. The consensus is for 210 thousand unchanged from 210 thousand last week.
 8:30 AM: Employment Report for May. The consensus is for 320,000 jobs added, and for the unemployment rate to decline to 3.5%.
There were 428,000 jobs added in April, and the unemployment rate was at 3.6%.
This graph shows the job losses from the start of the employment recession, in percentage terms.
The current employment recession was by far the worst recession since WWII in percentage terms. However, the current employment recession, 25 months after the onset, has recovered quicker than the previous two recessions.
10:00 AM: the ISM Services Index for May. The consensus is for a reading of 56.4, down from 57.1.


