by Calculated Risk on 3/07/2022 09:42:00 AM
Monday, March 07, 2022
Housing Inventory March 7th Update: Inventory Down 1.4% Week-over-week; New Record Low; Possible Bottom
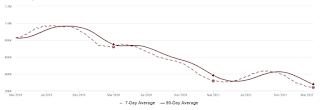
Tracking existing home inventory is very important in 2022.
Inventory usually declines in the winter, and this is a new record low for this series.

This inventory graph is courtesy of Altos Research.
As of March 4th, inventory was at 241 thousand (7-day average), compared to 318 thousand for the same week a year ago. That is a decline of 24.2%.
A week ago, inventory was at 244 thousand, and was down 24.9% YoY.
Inventory was down 1.4% from the previous week.
Compared to the same week in 2020, inventory is down 66.5% from 720 thousand.
Last year inventory bottomed seasonally in April 2021 - very late in the year. An early key in 2022 will be to watch if inventory bottoms earlier this year.
| Week Ending | YoY Change |
|---|---|
| 12/31/2021 | -30.0% |
| 1/7/2022 | -26.0% |
| 1/14/2022 | -28.6% |
| 1/21/2022 | -27.1% |
| 1/28/2022 | -25.9% |
| 2/4/2022 | -27.9% |
| 2/11/2022 | -27.5% |
| 2/18/2022 | -25.8% |
| 2/25/2022 | -24.9% |
| 3/4/2022 | -24.2% |
Based on the trend, it appears possible inventory bottomed seasonally last week, and will be up week-over-week in the next report.
Mike Simonsen discusses this data regularly on Youtube.


