 RSS Feed
 by Calculated Risk on 3/22/2022 02:30:00 PM
Tuesday, March 22, 2022
Distressing Gap: Existing and New Home Sales
By request, here is an update to the "distressing gap" graph that I first started posting following the housing bubble to show the emerging gap caused by distressed sales.
I haven't posted this in a couple of years since the pandemic distorted the numbers.
 The "distressing gap" graph shows existing home sales (left axis) and new home sales (right axis) through January 2022. This graph starts in 1994, but the relationship had been fairly steady back to the '60s.
Following the housing bubble and bust, the "distressing gap" appeared mostly because of distressed sales.
In 2020, the gap was mostly closed with help from the pandemic.
However, now the gap has returned somewhat, probably due to supply constraints limiting new home sales (and the recent boost to existing home sales due to low mortgage rates, favorable demographics, and strong investor buying).
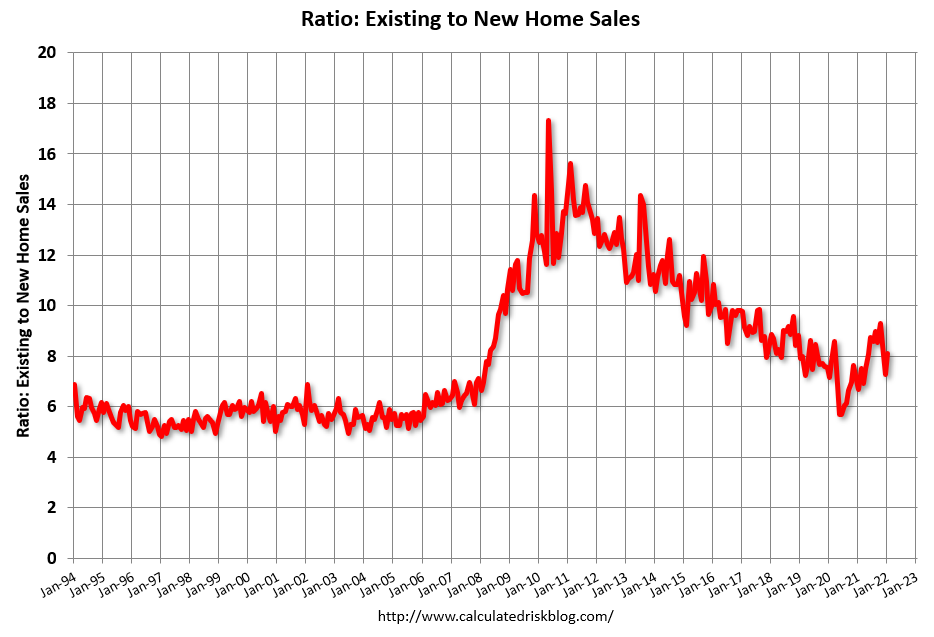
 Another way to look at this is a ratio of existing to new home sales.
This ratio was fairly stable from 1994 through 2006, and then the flood of distressed sales kept the number of existing home sales elevated and depressed new home sales. (Note: This ratio was fairly stable back to the early '70s, but I only have annual data for the earlier years).
In general, the ratio has been trending down since the housing bust - and was close to the historical ratio before the pandemic.
Note: Existing home sales are counted when transactions are closed, and new home sales are counted when contracts are signed. So, the timing of sales is different.


