 RSS Feed
 by Calculated Risk on 3/04/2022 03:59:00 PM
Friday, March 04, 2022
AAR: February Rail Carloads and Intermodal Up Year-over-year; Still Soft
From the Association of American Railroads (AAR) Rail Time Indicators. Graphs and excerpts reprinted with permission.
U.S. rail carloads were up 11.0% in February 2022 over February 2021, but that’s misleading — the big percentage gain is mainly a function of weak carloads in February 2021 caused by severe winter storms back then in Texas and elsewhere. (The third week of February 2021 had the fewest rail carloads of any week in our records going back to 1988.) For the first two months of 2022, carloads were up 3.6% ...
U.S. intermodal volume in February 2022 was up 1.4% over last year
emphasis added
 Click on graph for larger image.
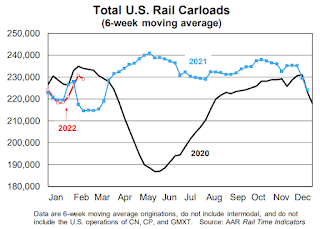
This graph from the Rail Time Indicators report shows the six-week average of U.S. Carloads in 2019, 2020 and 2021:
Total carloads were 915,329 in February 2022, an average of 228,832 per week. Other than February 2020, that’s the lowest weekly average for a February since sometime before 1988, when our U.S. rail traffic data begin.
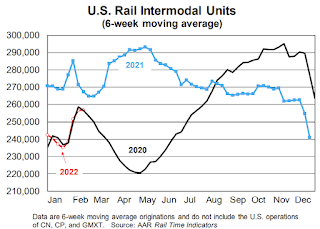 The second graph shows the six-week average (not monthly) of U.S. intermodal in 2019, 2020 and 2021: (using intermodal or shipping containers):
Volume in February 2022 was 1.03 million, up 1.4% (14,294 containers and trailers) over February 2021. The weekly average in February 2022 was 238,220, well below the first half 2021 weekly average of 282,004 and the second half 2021 average of 261,938. The two-month total in 2022 was 2.03 million. Since 2016, only 2020 had a lower January-February total.


