 RSS Feed
 by Calculated Risk on 1/07/2022 11:00:00 AM
Friday, January 07, 2022
Comments on December Employment Report
The headline jobs number in the December employment report was below expectations, however, employment for the previous two months was revised up by 141,000. The participation rate was unchanged, the employment-population ratio increased, and the unemployment rate decreased to 3.9%.
Leisure and hospitality gained 53 thousand jobs in December. In March and April of 2020, leisure and hospitality lost 8.22 million jobs, and are now down 1.22 million jobs since February 2020. So, leisure and hospitality has now added back about 85% all of the jobs lost in March and April 2020.
Construction employment increased 22 thousand and is now 88 thousand below the pre-pandemic level.
Manufacturing added 26 thousand jobs and is still 219 thousand below the pre-pandemic level.
State and Local education lost 10 thousand jobs, seasonally adjusted. This accounted for most of the 12 thousand public sector jobs lost in December.
Earlier: December Employment Report: 199 thousand Jobs, 3.9% Unemployment Rate
In December, the year-over-year employment change was 6.45 million jobs, making 2021 the best year ever for job growth.
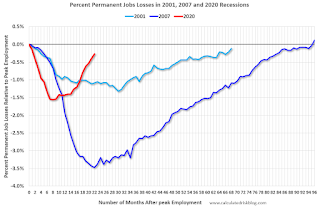
Permanent Job Losers
 Click on graph for larger image.
This graph shows permanent job losers as a percent of the pre-recession peak in employment through the report today. (ht Joe Weisenthal at Bloomberg).
Earlier: December Employment Report: 199 thousand Jobs, 3.9% Unemployment Rate
In December, the year-over-year employment change was 6.45 million jobs, making 2021 the best year ever for job growth.
Permanent Job Losers
Click on graph for larger image.This graph shows permanent job losers as a percent of the pre-recession peak in employment through the report today. (ht Joe Weisenthal at Bloomberg).
This data is only available back to 1994, so there is only data for three recessions.
In December, the number of permanent job losers decreased to 1.703 million from 1.905 million in November.
In December, the number of permanent job losers decreased to 1.703 million from 1.905 million in November.
These jobs will likely be the hardest to recover, so it is a positive that the number of permanent job losers is declining fairly rapidly.
Prime (25 to 54 Years Old) Participation
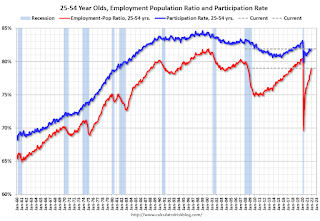 Since the overall participation rate has declined due to cyclical (recession) and demographic (aging population, younger people staying in school) reasons, here is the employment-population ratio for the key working age group: 25 to 54 years old.
The prime working age will be key as the economy recovers.
The 25 to 54 participation rate was unchanged in December at 81.9% from 81.9% in November, and the 25 to 54 employment population ratio increased to 79.0% from 78.8% the previous month.
Both are still low, compared to the pre-pandemic levels, and indicate that some prime workers have still not returned to the labor force.
Seasonal Retail Hiring
Typically, retail companies start hiring for the holiday season in October, and really increase hiring in November. Here is a graph that shows the historical net retail jobs added for October, November and December by year.
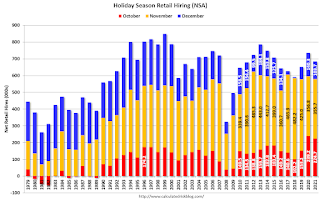 This graph really shows the collapse in retail hiring in 2008. Since then, seasonal hiring had increased back close to more normal levels. Note: I expect the long-term trend will be down with more and more internet holiday shopping.
Retailers hired 104 thousand workers Not Seasonally Adjusted (NSA) net in December.
Seasonal Retail Hiring
Typically, retail companies start hiring for the holiday season in October, and really increase hiring in November. Here is a graph that shows the historical net retail jobs added for October, November and December by year.
This graph really shows the collapse in retail hiring in 2008. Since then, seasonal hiring had increased back close to more normal levels. Note: I expect the long-term trend will be down with more and more internet holiday shopping.Retailers hired 104 thousand workers Not Seasonally Adjusted (NSA) net in December.
This was close normal, and seasonally adjusted (SA) to a loss of 2 thousand jobs in December.
Part Time for Economic Reasons
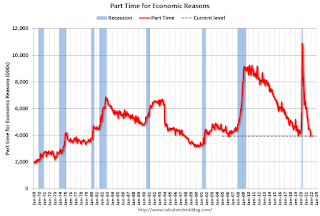 From the BLS report:
"The number of persons employed part time for economic reasons, at 3.9 million in December, decreased by 337,000 over the month. The over-the-year decline of 2.2 million brings this measure to 461,000 below its February 2020 level. These individuals, who would have preferred full-time employment, were working part time because their hours had been reduced or they were unable to find full-time jobs."The number of persons working part time for economic reasons decreased in December to 3.929 million from 4.466 million in November. This is at pre-recession levels.
These workers are included in the alternate measure of labor underutilization (U-6) that decreased to 7.3% from 7.7% in the previous month. This is down from the record high in April 22.9% for this measure since 1994. This measure was at 7.0% in February 2020 (pre-pandemic).
Unemployed over 26 Weeks
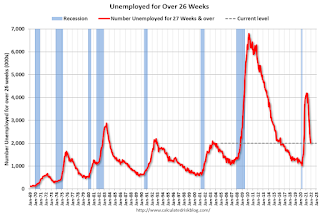 This graph shows the number of workers unemployed for 27 weeks or more.
 According to the BLS, there are 2.008 million workers who have been unemployed for more than 26 weeks and still want a job, down from 2.193 million the previous month.
This does not include all the people that left the labor force.
Summary:
The headline monthly jobs number was below expectations; however, the previous two months were revised up by 141,000 combined. This was the most jobs added in a single calendar year ever (6.45 million), but not as a percent of the labor force (that happened after WWII).
And the headline unemployment rate decreased to 3.9%. The household survey indicated a large gain in employment of 651 thousand, and that led to a sharp decrease in the unemployment rate and an increase in the employment-population ratio.
The prime age participation rate and employment-population ratio, are still below pre-pandemic levels, indicating some prime workers are still out of the labor force. And there are still 3.6 million fewer jobs than prior to the recession.


