 RSS Feed
 by Calculated Risk on 11/14/2021 02:13:00 PM
Sunday, November 14, 2021
The Labor Force Participation Rate
On Friday, Goldman Sachs economists put out a research note on the labor force participation rate: Why Isn’t Labor Force Participation Recovering?
Here are few excerpts from the note:
 Click on graph for larger image.
The Labor Force Participation Rate was unchanged at 61.6% in October, from 61.6% in September. This is the percentage of the working age population in the labor force.
The Employment-Population ratio increased to 58.8% from 58.7% (black line).
While the unemployment rate continues to fall quickly, labor force participation has made no progress since August 2020. ... Most of the 5.0mn persons who have exited the labor force since the start of the pandemic are over age 55 (3.4mn), largely reflecting early (1.5mn) and natural (1mn) retirements that likely won’t reverse. The outlook for prime-age persons who have exited the labor force (1.7mn) is more positive, since very few are discouraged and most still view their exits as temporary.
First, there are two important monthly surveys from the BLS. The participation rate (and unemployment rate) comes from the Current Population Survey (CPS: commonly called the household survey), a monthly survey of about 60,000 households.
The jobs number comes from Current Employment Statistics (CES: payroll survey), a sample of approximately 634,000 business establishments nationwide.
These are very different surveys: the CPS gives the total number of employed (and unemployed including the alternative measures), and the CES gives the total number of positions (excluding some categories like the self-employed, and a person working two jobs counts as two positions).
Currently the payroll survey shows there are 4.2 million fewer jobs than in February 2020 (pre-pandemic).
The household survey shows there are 2.99 million fewer people in the labor force than in February 2020. The 5 million number probably assumes some normal labor force growth, however, overall population growth has been dismal over the last 2 years (little immigration and large number of deaths). I'm not confident in Goldman's 5 million person estimate.
Here is a graph that shows the employment population ratio and the participation rate through the October 2021 employment report.
 Click on graph for larger image.
The Labor Force Participation Rate was unchanged at 61.6% in October, from 61.6% in September. This is the percentage of the working age population in the labor force.
The Employment-Population ratio increased to 58.8% from 58.7% (black line).
Both are far below the pre-pandemic levels, however the overall participation rate was expected to decline due to demographics.
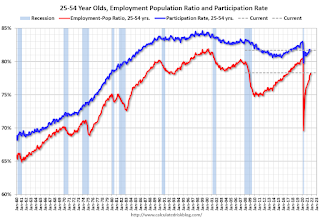 Since the overall participation rate has declined due to the pandemic and demographic (aging population, younger people staying in school) reasons, here is the employment-population ratio for the key working age group: 25 to 54 years old.
The 25 to 54 participation rate increased in October to 81.7% from 81.6% in September, and the 25 to 54 employment population ratio increased to 78.3% from 78.0% in September.
Both are still low and indicate that many prime workers have still not returned to the labor force.
In the note, Goldman argues "Most of the 5.0mn persons who have exited the labor force since the start of the pandemic are over age 55 (3.4mn), largely reflecting early (1.5mn) and natural (1mn) retirements that likely won’t reverse." There probably have been a large number of people retiring over the last 2 years, but I think more at least half of the people missing from the labor force are prime age.
 Here is a graph of the change in the participation rate by age cohort (October 2019, October 2020, and October 2021 NSA).
 Here is a graph of the change in the participation rate by age cohort (October 2019, October 2020, and October 2021 NSA).
If more older people were retiring than expected, we'd see a decline from Blue (pre-pandemic) to Red (pandemic) to Black (October 2021). We do see this for the "70 to 74" and "75+" age groups. And this does suggest more retirements than expected in the 70+ age groups.
However the "55 to 59", "60 to 64" and "65 to 69" age groups are recovering similar to the prime age groups.
If we calculate the expected labor force by cohort, using the pre-pandemic participation rates, about 50% of the people missing from the labor force are in the prime working age (25 to 54). About 75% of the people missing are in the 20 to 65 age group.
This suggests to me that there is more slack in the labor market than Goldman estimates.


