 RSS Feed
 by Calculated Risk on 9/30/2021 09:00:00 PM
Thursday, September 30, 2021
Friday: Personal Income & Outlays, ISM Mfg, Construction Spending, Vehicle Sales
Friday:
• At 8:30 AM ET, Personal Income and Outlays for August. The consensus is for a 0.3% increase in personal income, and for a 0.6% increase in personal spending. And for the Core PCE price index to increase 0.2%.
• At 10:00 AM, ISM Manufacturing Index for September. The consensus is for a reading of 59.5, down from 59.9 in August.
• Also at 10:00 AM, Construction Spending for August. The consensus is for a 0.3% increase.
• Late: Light vehicle sales for September. The consensus is for sales of 13.4 million SAAR, up from 13.1 million SAAR in August (Seasonally Adjusted Annual Rate).
September 30th COVID-19: Progress
by Calculated Risk on 9/30/2021 07:12:00 PM
The CDC is the source for all data.
According to the CDC, on Vaccinations. Total doses administered: 392,909,995, as of a week ago 387,821,704, or 0.85 million doses per day.
| COVID Metrics | ||||
|---|---|---|---|---|
| Today | Week Ago | Goal | ||
| Percent fully Vaccinated | 55.6% | 55.0% | ≥70.0%1 | |
| Fully Vaccinated (millions) | 184.6 | 182.6 | ≥2321 | |
| New Cases per Day3 | 106,394 | 122,659 | ≤5,0002 | |
| Hospitalized3 | 73,437 | 82,827 | ≤3,0002 | |
| Deaths per Day3 | 1,476 | 1,527 | ≤502 | |
| 1 Minimum to achieve "herd immunity" (estimated between 70% and 85%). 2my goals to stop daily posts, 37 day average for Cases, Currently Hospitalized, and Deaths 🚩 Increasing 7 day average week-over-week for Cases, Hospitalized, and Deaths ✅ Goal met. | ||||
IMPORTANT: For "herd immunity" most experts believe we need 70% to 85% of the total population fully vaccinated (or already had COVID).
KUDOS to the residents of the 13 states and D.C. that have achieved 60% of total population fully vaccinated: Vermont at 69.5%, Connecticut, Maine, Rhode Island, Massachusetts, New Jersey, Maryland, New York, New Mexico, New Hampshire, Washington, Oregon, Virginia, and District of Columbia at 60.1%.
The following 21 states have between 50% and 59.9% fully vaccinated: Colorado at 59.4%, California, Minnesota, Hawaii, Pennsylvania, Delaware, Florida, Wisconsin, Texas, Nebraska, Iowa, Illinois, Michigan, Kentucky, South Dakota, Arizona, Kansas, Nevada, Alaska, Utah and Ohio at 50.2%.
Next up (total population, fully vaccinated according to CDC) are North Carolina 49.8%, Montana at 48.5%, and Indiana at 48.4% .
 Click on graph for larger image.
This graph shows the daily (columns) and 7 day average (line) of positive tests reported.
Fannie Mae: Mortgage Serious Delinquency Rate Decreased in August
by Calculated Risk on 9/30/2021 04:34:00 PM
Fannie Mae reported that the Single-Family Serious Delinquency decreased to 1.79% in August, from 1.94% in July. The serious delinquency rate is down from 3.32% in August 2020.
These are mortgage loans that are "three monthly payments or more past due or in foreclosure".
The Fannie Mae serious delinquency rate peaked in February 2010 at 5.59% following the housing bubble, and peaked at 3.32% in August 2020 during the pandemic.
 Click on graph for larger image
By vintage, for loans made in 2004 or earlier (1% of portfolio), 4.47% are seriously delinquent (down from 4.82% in July). For loans made in 2005 through 2008 (2% of portfolio), 7.57% are seriously delinquent (down from 8.26%), For recent loans, originated in 2009 through 2021 (97% of portfolio), 1.46% are seriously delinquent (down from 1.57%). So Fannie is still working through a few poor performing loans from the bubble years.
Mortgages in forbearance are counted as delinquent in this monthly report, but they will not be reported to the credit bureaus.
This is very different from the increase in delinquencies following the housing bubble. Lending standards have been fairly solid over the last decade, and most of these homeowners have equity in their homes - and they will be able to restructure their loans once they are employed.
Freddie Mac reported earlier.
Q3 2021 Update: Unofficial Problem Bank list Decreased to 59 Institutions
by Calculated Risk on 9/30/2021 03:29:00 PM
The FDIC's official problem bank list is comprised of banks with a CAMELS rating of 4 or 5, and the list is not made public (just the number of banks and assets every quarter). Note: Bank CAMELS ratings are also not made public.
CAMELS is the FDIC rating system, and stands for Capital adequacy, Asset quality, Management, Earnings, Liquidity and Sensitivity to market risk. The scale is from 1 to 5, with 1 being the strongest.
As a substitute for the CAMELS ratings, surferdude808 is using publicly announced formal enforcement actions, and also media reports and company announcements that suggest to us an enforcement action is likely, to compile a list of possible problem banks in the public interest.
DISCLAIMER: This is an unofficial list, the information is from public sources only, and while deemed to be reliable is not guaranteed. No warranty or representation, expressed or implied, is made as to the accuracy of the information contained herein and same is subject to errors and omissions. This is not intended as investment advice. Please contact CR with any errors.
Here are the quarterly changes and a few comments from surferdude808:
Update on the Unofficial Problem Bank List through September 27, 2021. Since the last update at the end of June 2021, the list decreased by six to 59 institutions after two additions and eight removals. Assets increased by $3.1 billion to $54.9 billion, with the change entirely from nearly a $5.0 billion increase from updated asset figures through June 30, 2021. A year ago, the list held 64 institutions with assets of $52.4 billion. Additions this month included The Anna-Jonesboro National Bank, Anna, IL ($268 million) and First Savanna Savings Bank, Savanna, IL ($11 million). Removals because of action termination included Patriot Bank, National Association, Stamford, CT ($963 million); CFSBank, Charleroi, PA ($545 million); Metropolitan Capital Bank & Trust, Chicago, IL ($245 million); South LaFourche Bank & Trust Company, Larose, LA ($145 million); AllNations Bank, Calumet, OK ($48 million); and Sainte Marie State Bank, Sainte Marie, IL ($16 million). Removals through unassisted merger included Jackson County Bank, Black River Falls, WI ($205 million) and Towanda State Bank, Towanda, KS ($11 million). On September 8, 2021, the FDIC released second quarter results and provided an update on the Official Problem Bank List. In that release, the FDIC said there were 51 institutions with assets of $46 billion on the official list, down from the 54 institutions with assets of $55 billion in the first quarter of 2021.
With the conclusion of the second quarter, we bring an updated transition matrix to detail how banks are transitioning off the Unofficial Problem Bank List. Since we first published the Unofficial Problem Bank List on August 7, 2009 with 389 institutions, 1,779 institutions have appeared on a weekly or monthly list since then. Only 3.3 percent of the banks that have appeared on a list remain today as 1,720 institutions have transitioned through the list. Departure methods include 1,014 action terminations, 411 failures, 276 mergers, and 19 voluntary liquidations. Of the 389 institutions on the first published list, only 3 or less than 1.0 percent, still have a troubled designation more than ten years later. The 411 failures represent 23.1 percent of the 1,779 institutions that have made an appearance on the list. This failure rate is well above the 10-12 percent rate frequently cited in media reports on the failure rate of banks on the FDIC's official list.
Las Vegas Visitor Authority for August: Convention Attendance N/A, Visitor Traffic Down 16% Compared to 2019
by Calculated Risk on 9/30/2021 02:10:00 PM
From the Las Vegas Visitor Authority: August 2021 Las Vegas Visitor Statistics
With the Delta variant of the COVID virus spiking during the month, August visitation receded from the pandemic‐era peak in July, coming in at just under 3.0M visitors, down ‐ 9.2% MoM and down ‐16.2% from August 2019.
Hotel occupancy reached 72.8% for the month (down 6.6 pts MoM, down ‐14.9 pts vs. August 2019), as Weekend occupancy remained fairly strong at 87.1% (down ‐1.0 pts MoM) while Midweek occupancy dipped to 67.8% (down ‐6.8 pts MoM).
Although down from July, August ADR was the second highest in the pandemic era, exceeding $140, down ‐7.8% MoM but up 16.0% vs. August 2019. RevPAR came in at $102, ‐15.4% MoM and down ‐3.7% vs. August 2019.
 Click on graph for larger image.
 Thist graph shows visitor traffic for 2019 (blue), 2020 (orange) and 2021 (red).
Visitor traffic was down 16.2% compared to the same month in 2019.
There had been no convention traffic since March 2020, but there have been a few conventions since June 2021 (data not available yet).
I'll add a graph of convention traffic once convention data is available.
Hotels: Occupancy Rate Down 11.0% Compared to Same Week in 2019
by Calculated Risk on 9/30/2021 10:47:00 AM
Note: The year-over-year occupancy comparisons are easy, since occupancy declined sharply at the onset of the pandemic, so CoStar is comparing to 2019.
From CoStar: STR: US Hotel Occupancy Stays Flat Week Over Week
U.S. hotel occupancy remained relatively flat week over week, while average daily rate rose, according to STR‘s latest data through September 25.The following graph shows the seasonal pattern for the hotel occupancy rate using the four week average.
September 19-25, 2021 (percentage change from comparable week in 2019*):
• Occupancy: 63.2% (-11.0%)
• Average daily rate (ADR): $133.69 (-2.0%)
• Revenue per available room (RevPAR): $84.54 (-12.8%)
A week after eclipsing 1 million for the first time since the earliest days of the pandemic, group demand rose again to almost 1.3 million for the week. At the same time, group ADR moved past $200 for the first time since February 2020.
emphasis added
 Click on graph for larger image.
The red line is for 2021, black is 2020, blue is the median, dashed purple is 2019, and dashed light blue is for 2009 (the worst year on record for hotels prior to 2020).
Note: Y-axis doesn't start at zero to better show the seasonal change.
The Summer months had decent occupancy with solid leisure travel, and occupancy was only off about 7% in July and August compared to 2019.
But it is uncertain what will happen over the next couple of months with business travel. Usually weekly occupancy increases to around 70% in the weeks following Labor Day due to renewed business travel.
Weekly Initial Unemployment Claims Increase to 362,000
by Calculated Risk on 9/30/2021 08:45:00 AM
The DOL reported:
In the week ending September 25, the advance figure for seasonally adjusted initial claims was 362,000, an increase of 11,000 from the previous week's unrevised level of 351,000. The 4-week moving average was 340,000, an increase of 4,250 from the previous week's unrevised average of 335,750.The following graph shows the 4-week moving average of weekly claims since 1971.
emphasis added
 Click on graph for larger image.
The dashed line on the graph is the current 4-week average. The four-week average of weekly unemployment claims increased to 340,000.
The previous week was unrevised.
Regular state continued claims decreased to 2,802,000 (SA) from 2,820,000 (SA) the previous week.
Note (released with a 2 week delay): There were an additional 1,059,248 receiving Pandemic Unemployment Assistance (PUA) that decreased from 4,896,125 the previous week (there are questions about these numbers). This was a special program for business owners, self-employed, independent contractors or gig workers not receiving other unemployment insurance. And threre were an additional 991,813 receiving Pandemic Emergency Unemployment Compensation (PEUC) down from 3,644,555.
Weekly claims were higher than the consensus forecast.
Q2 GDP Growth Revised up to 6.7% Annual Rate
by Calculated Risk on 9/30/2021 08:34:00 AM
From the BEA: Gross Domestic Product, (Third Estimate), GDP by Industry, and Corporate Profits (Revised), 2nd Quarter 2021
Real gross domestic product (GDP) increased at an annual rate of 6.7 percent in the second quarter of 2021, according to the "third" estimate released by the Bureau of Economic Analysis. In the first quarter, real GDP increased 6.3 percent.Here is a Comparison of Third and Second Estimates. PCE growth was revised up from 11.9% to 12.0%. Residential investment was revised down from -11.5% to -11.7%. This was at the consensus forecast.
The "third" estimate of GDP released today is based on more complete source data than were available for the "second" estimate issued last month. In the second estimate, the increase in real GDP was 6.6 percent. Upward revisions to personal consumption expenditures (PCE), exports, and private inventory investment were partly offset by an upward revision to imports, which are a subtraction in the calculation of GDP
emphasis added
Wednesday, September 29, 2021
Thursday: GDP, Unemployment Claims, Chicago PMI
by Calculated Risk on 9/29/2021 09:04:00 PM
Thursday:
• At 8:30 AM ET, The initial weekly unemployment claims report will be released. The consensus is for 335 thousand initial claims, down from 351 thousand last week.
• Also at 8:30 AM, Gross Domestic Product, 2nd quarter 2021 (Third estimate). The consensus is that real GDP increased 6.7% annualized in Q2, revised up from the second estimate of 6.6%.
• At 9:45 AM, Chicago Purchasing Managers Index for September. The consensus is for a reading of 65.0, down from 66.8 in August.
September 29th COVID-19: 7-Day Average Cases Off 30% from Recent Peak
by Calculated Risk on 9/29/2021 06:31:00 PM
The CDC is the source for all data.
According to the CDC, on Vaccinations. Total doses administered: 391,992,662, as of a week ago 387,493,716, or 0.75 million doses per day.
| COVID Metrics | ||||
|---|---|---|---|---|
| Today | Week Ago | Goal | ||
| Percent fully Vaccinated | 55.9% | 54.9% | ≥70.0%1 | |
| Fully Vaccinated (millions) | 185.5 | 182.4 | ≥2321 | |
| New Cases per Day3 | 110,232 | 131,736 | ≤5,0002 | |
| Hospitalized3 | 74,923 | 83,786 | ≤3,0002 | |
| Deaths per Day3 | 1,487 | 1,508 | ≤502 | |
| 1 Minimum to achieve "herd immunity" (estimated between 70% and 85%). 2my goals to stop daily posts, 37 day average for Cases, Currently Hospitalized, and Deaths 🚩 Increasing 7 day average week-over-week for Cases, Hospitalized, and Deaths ✅ Goal met. | ||||
IMPORTANT: For "herd immunity" most experts believe we need 70% to 85% of the total population fully vaccinated (or already had COVID).
KUDOS to the residents of the 13 states and D.C. that have achieved 60% of total population fully vaccinated: Vermont at 69.4%, Connecticut, Maine, Rhode Island, Massachusetts, New Jersey, Maryland, New York, New Mexico, New Hampshire, Washington, Oregon, Virginia, and District of Columbia at 60.1%.
The following 21 states have between 50% and 59.9% fully vaccinated: Colorado at 59.3%, California, Minnesota, Hawaii, Pennsylvania, Delaware, Florida, Wisconsin, Texas, Nebraska, Iowa, Illinois, Michigan, Kentucky, South Dakota, Arizona, Kansas, Nevada, Alaska, Utah and Ohio at 50.2%.
Next up (total population, fully vaccinated according to CDC) are North Carolina 49.7%, Montana at 48.4%, and Indiana at 48.3% .
 Click on graph for larger image.
This graph shows the daily (columns) and 7 day average (line) of positive tests reported.
Real House Prices, Price-to-Rent Ratio and Price-to-Median Income in July
by Calculated Risk on 9/29/2021 12:19:00 PM
Today, in the Newsletter: Real House Prices, Price-to-Rent Ratio and Price-to-Median Income in July
Excerpt:
This graph uses the year end Case-Shiller house price index - and the nominal median household income through 2020 (from the Census Bureau). 2021 median income is estimated at a 5% annual gain.
By all of the above measures, house prices appear elevated.

NAR: Pending Home Sales Increased 8.1% in August
by Calculated Risk on 9/29/2021 10:03:00 AM
From the NAR: Pending Home Sales Recover 8.1% in August
Pending home sales rebounded in August, recording significant gains after two prior months of declines, according to the National Association of Realtors®. Each of the four major U.S. regions mounted month-over-month growth in contract activity. However, those same territories reported decreases in transactions year-over-year, with the Northeast being hit hardest, enduring a double-digit drop.This was well above expectations of a 1.3% increase for this index. Note: Contract signings usually lead sales by about 45 to 60 days, so this would usually be for closed sales in September and October.
The Pending Home Sales Index (PHSI), a forward-looking indicator of home sales based on contract signings, increased 8.1% to 119.5 in August. Year-over-year, signings dipped 8.3%. An index of 100 is equal to the level of contract activity in 2001.
...
Month-over-month, the Northeast PHSI rose 4.6% to 96.2 in August, a 15.8% drop from a year ago. In the Midwest, the index climbed 10.4% to 115.4 last month, down 5.9% from August 2020.
Pending home sales transactions in the South increased 8.6% to an index of 141.8 in August, down 6.3% from August 2020. The index in the West grew 7.2% in August to 107.0, however still down 9.2% from a year prior.
emphasis added
MBA: Mortgage Applications Decrease in Latest Weekly Survey
by Calculated Risk on 9/29/2021 07:00:00 AM
From the MBA: Mortgage Applications Decrease in Latest MBA Weekly Survey
Mortgage applications decreased 1.1 percent from one week earlier, according to data from the Mortgage Bankers Association’s (MBA) Weekly Mortgage Applications Survey for the week ending September 24, 2021.
... The Refinance Index decreased 1 percent from the previous week and was 0.4 percent higher than the same week one year ago. The seasonally adjusted Purchase Index decreased 1 percent from one week earlier. The unadjusted Purchase Index decreased 2 percent compared with the previous week and was 12 percent lower than the same week one year ago.
“Increased optimism about the strength of the economy pushed Treasury yields higher following last week’s FOMC meeting. Mortgage rates in response rose across all loan types, with the benchmark 30- year fixed rate reaching its highest level since early July 2021,” said Joel Kan, MBA’s Associate Vice President of Economic and Industry Forecasting. “The increase in rates – mostly later in the week – led to a decrease in both purchase and refinance applications, with a prominent decline in government loan applications. Conventional loan applications increased, driven by a rise in conventional refinances. This was perhaps a sign that some borrowers reacted to higher rates and decided to refinance.”
Added Kan, “With home-price appreciation continuing to run hot, increasing more than 19 percent annually in July, applications for larger loan amounts continue to outpace lower-balance loans. The average loan size for a purchase application reached $410,000, its highest level since May 2021.”
...
The average contract interest rate for 30-year fixed-rate mortgages with conforming loan balances ($548,250 or less) increased to 3.10 percent from 3.03 percent, with points increasing to 0.34 from 0.30 (including the origination fee) for 80 percent loan-to-value ratio (LTV) loans.
emphasis added
 Click on graph for larger image.
The first graph shows the refinance index since 1990.
With low rates, the index remains elevated.
The second graph shows the MBA mortgage purchase index
 According to the MBA, purchase activity is down 12% year-over-year unadjusted.
Note: The year ago comparisons for the unadjusted purchase index are now difficult since purchase activity picked up in late May 2020.
Note: Red is a four-week average (blue is weekly).
Tuesday, September 28, 2021
September 28th COVID-19
by Calculated Risk on 9/28/2021 09:27:00 PM
The CDC is the source for all data. (Cases and Deaths were not updated today).
According to the CDC, on Vaccinations. Total doses administered: 391,152,574, as of a week ago 386,780,816, or 0.62 million doses per day.
| COVID Metrics | ||||
|---|---|---|---|---|
| Today | Week Ago | Goal | ||
| Percent fully Vaccinated | 55.8% | 54.8% | ≥70.0%1 | |
| Fully Vaccinated (millions) | 185.3 | 182.0 | ≥2321 | |
| New Cases per Day3 | 95,228 | 134,500 | ≤5,0002 | |
| Hospitalized3 | 76,251 | 84,925 | ≤3,0002 | |
| Deaths per Day3 | 1,332 | 1,508 | ≤502 | |
| 1 Minimum to achieve "herd immunity" (estimated between 70% and 85%). 2my goals to stop daily posts, 37 day average for Cases, Currently Hospitalized, and Deaths 🚩 Increasing 7 day average week-over-week for Cases, Hospitalized, and Deaths ✅ Goal met. | ||||
IMPORTANT: For "herd immunity" most experts believe we need 70% to 85% of the total population fully vaccinated (or already had COVID).
KUDOS to the residents of the 13 states and D.C. that have achieved 60% of total population fully vaccinated: Vermont at 69.4%, Connecticut, Maine, Rhode Island, Massachusetts, New Jersey, Maryland, New York, New Mexico, New Hampshire, Washington, Oregon, Virginia, and District of Columbia at 60.0%.
The following 21 states have between 50% and 59.9% fully vaccinated: Colorado at 59.2%, California, Minnesota, Hawaii, Pennsylvania, Delaware, Florida, Wisconsin, Texas, Nebraska, Iowa, Illinois, Michigan, Kentucky, South Dakota, Arizona, Kansas, Nevada, Alaska, Utah and Ohio at 50.1%.
Next up (total population, fully vaccinated according to CDC) are North Carolina 49.6%, Indiana at 48.3% and Montana at 48.3%.
 Click on graph for larger image.
This graph shows the daily (columns) and 7 day average (line) of positive tests reported.
Wednesday: Pending Home Sales, Fed Chair Powell
by Calculated Risk on 9/28/2021 09:00:00 PM
Wednesday:
• At 7:00 AM ET, The Mortgage Bankers Association (MBA) will release the results for the mortgage purchase applications index.
• At 10:00 AM, Pending Home Sales Index for August. The consensus is 1.3% increase in the index.
• At 11:45 AM, Discussion, Fed Chair Powell, Policy Panel Discussion, At the European Central Bank Forum on Central Banking
Zillow Case-Shiller House Price Forecast: National Index Growth to Increase Slightly to 20.0% in August
by Calculated Risk on 9/28/2021 07:57:00 PM
The Case-Shiller house price indexes for July were released this morning. Zillow forecasts Case-Shiller a month early, and I like to check the Zillow forecasts since they have been pretty close.
From Matthew Speakman at Zillow: July 2021 Case-Shiller Results & Forecast: Scorching Hot
The slow rise in inventory that marked the beginning of summer wasn’t enough to cool the sizzling market, with the already rapidly rising Case-Shiller indices hitting the gas accelerating into the middle of the year instead of tapping the brakes.
...
Home price growth remained scorching hot as the housing market entered the dog days of summer, but data released in the weeks since indicate cooler days in the months to come. With mortgage rates still near historic lows, competition for the relatively few for-sale homes remain very stiff and home prices continue to rise sharply as a result. But the tight market conditions that have fueled the skyrocketing prices are finally showing signs of loosening. For-sale inventory levels charted their fourth consecutive monthly increase in August, and sellers appear to be taking a less aggressive approach when putting their homes on the market. Annual growth in list prices peaked in the spring and price cuts are becoming more common. And while still-strong price growth continues to present challenging conditions for many would-be buyers, the softening market conditions do appear to be offering some home shoppers a reprieve. Home sales volumes improved in August and applications for home purchase mortgages – a leading indicator of sales activity – has risen in four of the last five week to reach its highest level since April. Price growth remains about as hot as ever, but the housing market is gradually retreating towards a more balanced state.
Monthly and annual growth in August as reported by Case-Shiller is expected to accelerate from July in all three main indices. S&P Dow Jones Indices is expected to release data for the June S&P CoreLogic Case-Shiller Indices on Tuesday, October 26.
emphasis added
 The Zillow forecast is for the year-over-year change for the Case-Shiller National index to be at 20.0% in August, from 19.7% in July.
A few comments on the Seasonal Pattern for House Prices
by Calculated Risk on 9/28/2021 04:18:00 PM
A few key points:
1) There is a clear seasonal pattern for house prices.
2) The surge in distressed sales during the housing bust distorted the seasonal pattern.
3) Even though distressed sales are down significantly, the seasonal factor is based on several years of data - and the factor is now closer to normal (second graph below).
4) Still the seasonal index is probably a better indicator of actual price movements than the Not Seasonally Adjusted (NSA) index.
For in depth description of these issues, see Jed Kolko's article from 2014 (currently Chief Economist at Indeed) "Let’s Improve, Not Ignore, Seasonal Adjustment of Housing Data"
Note: I was one of several people to question the change in the seasonal factor (here is a post in 2009) - and this led to S&P Case-Shiller questioning the seasonal factor too (from April 2010). I still use the seasonal factor (I think it is better than using the NSA data).
 Click on graph for larger image.
This graph shows the month-to-month change in the NSA Case-Shiller National index since 1987 (through July 2021). The seasonal pattern was smaller back in the '90s and early '00s, and increased once the bubble burst.
The seasonal swings declined following the bubble, however the recent price surge changed the month-over-month pattern.
 The second graph shows the seasonal factors for the Case-Shiller National index since 1987. The factors started to change near the peak of the bubble, and really increased during the bust.
The swings in the seasonal factors have decreased, and the seasonal factors has been moving back towards more normal levels.
Note that the recent price surge hasn't distorted the seasonal factors.
Comments on House Prices
by Calculated Risk on 9/28/2021 11:51:00 AM
Today, in the Newsletter: House Prices Increase Sharply in July
Excerpt:
This graph below shows existing home months-of-supply (inverted, from the NAR) vs. the seasonally adjusted month-to-month price change in the Case-Shiller National Index (both since January 1999 through July 2021).
In July, the months-of-supply was at 2.6 months, and the Case-Shiller National Index (SA) increased 1.55% month-over-month. The black arrow points to the July 2021 dot.

Case-Shiller: National House Price Index increased 19.7% year-over-year in July
by Calculated Risk on 9/28/2021 09:12:00 AM
S&P/Case-Shiller released the monthly Home Price Indices for July ("July" is a 3 month average of May, June and July prices).
This release includes prices for 20 individual cities, two composite indices (for 10 cities and 20 cities) and the monthly National index.
From S&P: S&P Corelogic Case-Shiller Index Reports Record High 19.7% Annual Home Price Gain In July
The S&P CoreLogic Case-Shiller U.S. National Home Price NSA Index, covering all nine U.S. census divisions, reported a 19.7% annual gain in July, up from 18.7% in the previous month. The 10-City Composite annual increase came in at 19.1%, up from 18.5% in the previous month. The 20-City Composite posted a 19.9% year-over-year gain, up from 19.1% in the previous month.
Phoenix, San Diego, and Seattle reported the highest year-over-year gains among the 20 cities in July. Phoenix led the way with a 32.4% year-over-year price increase, followed by San Diego with a 27.8% increase and Seattle with a 25.5% increase. Seventeen of the 20 cities reported higher price increases in the year ending July 2021 versus the year ending June 2021.
...
Before seasonal adjustment, the U.S. National Index posted an 1.6% month-over-month increase in July, while the 10-City and 20-City Composites both posted increases of 1.3% and 1.5%, respectively.
After seasonal adjustment, the U.S. National Index posted a month-over-month increase of 1.5%, and the 10-City and 20-City Composites both posted increases of 1.4% and 1.5%, respectively. In July, all 20 cities reported increases before and after seasonal adjustments.
“July 2021 is the fourth consecutive month in which the growth rate of housing prices set a record, says Craig J. Lazzara, Managing Director and Global Head of Index Investment Strategy at S&P DJI. “The National Composite Index marked its fourteenth consecutive month of accelerating prices with a 19.7% gain from year-ago levels, up from 18.7% in June and 16.9% in May. This acceleration is also reflected in the 10- and 20-City Composites (up 19.1% and 19.9%, respectively). The last several months have been extraordinary not only in the level of price gains, but in the consistency of gains across the country. In July, all 20 cities rose, and 17 gained more in the 12 months ended in July than they had gained in the 12 months ended in June. Home prices in 19 of our 20 cities now stand at all-time highs, with the sole outlier (Chicago) only 0.3% below its 2006 peak. The National Composite, as well as the 10- and 20-City indices, are likewise at their all-time highs.
“July’s 19.7% price gain for the National Composite is the highest reading in more than 30 years of S&P CoreLogic Case-Shiller data. This month, New York joined Boston, Charlotte, Cleveland, Dallas, Denver, and Seattle in recording their all-time highest 12-month gains. Price gains in all 20 cities were in the top quintile of historical performance; in 15 cities, price gains were in the top five percent of historical performance.
“We have previously suggested that the strength in the U.S. housing market is being driven in part by a reaction to the COVID pandemic, as potential buyers move from urban apartments to suburban homes. July’s data are consistent with this hypothesis. This demand surge may simply represent an acceleration of purchases that would have occurred anyway over the next several years. Alternatively, there may have been a secular change in locational preferences, leading to a permanent shift in the demand curve for housing. More time and data will be required to analyze this question
emphasis added
 Click on graph for larger image.
 The first graph shows the nominal seasonally adjusted Composite 10, Composite 20 and National indices (the Composite 20 was started in January 2000).
The Composite 10 index is up 1.4% in July (SA).
The Composite 20 index is up 1.5% (SA) in July.
The National index is 43% above the bubble peak (SA), and up 1.5% (SA) in July. The National index is up 93% from the post-bubble low set in February 2012 (SA).
 The second graph shows the year-over-year change in all three indices.
The Composite 10 SA is up 19.2% compared to July 2020. The Composite 20 SA is up 20.0% year-over-year.
The National index SA is up 19.7% year-over-year.
Price increases were close to expectations. I'll have more later.
Monday, September 27, 2021
Tuesday: Case-Shiller House Prices, Fed Chair Powell Testimony
by Calculated Risk on 9/27/2021 09:00:00 PM
From Matthew Graham at Mortgage News Daily: Highest Mortgage Rates in Nearly 3 Months
Mortgage rates continued somewhat higher on Monday as bond markets lost ground over the weekend, adding to the heavier losses seen on Thursday and Friday last week. ... This improves the outlook for the economy and further steels the resolve of the Federal Reserve to announce another instance of "tapering" (a reduction in the pace of the Fed's rate-friendly bond buying efforts). Unlike 2013, markets are much more prepared this time around, and in fact, we can credit tapering expectations for some of the weakness in rates seen earlier this year.Tuesday:
The average lender is at an eighth to a quarter of a percent higher in conventional 30yr fixed rates compared to the beginning of last week. [30 year fixed 3.14%]
emphasis added
• At 9:00 AM ET, FHFA House Price Index for July. This was originally a GSE only repeat sales, however there is also an expanded index.
• Also at 9:00 AM, S&P/Case-Shiller House Price Index for July. The consensus is for a 20.0% year-over-year increase in the Comp 20 index for July.
• At 10:00 AM, the Richmond Fed manufacturing survey for September. This is the last of the regional surveys for September.
• Also at 10:00 AM, Testimony, Fed Chair Powell, Coronavirus and CARES Act, Before the U.S. Senate Committee on Banking, Housing, and Urban Affairs
Freddie Mac: Mortgage Serious Delinquency Rate decreased in August
by Calculated Risk on 9/27/2021 04:50:00 PM
Freddie Mac reported that the Single-Family serious delinquency rate in August was 1.62%, down from 1.74% in July. Freddie's rate is down year-over-year from 3.17% in August 2020.
Freddie's serious delinquency rate peaked in February 2010 at 4.20% following the housing bubble, and peaked at 3.17% in August 2020 during the pandemic.
These are mortgage loans that are "three monthly payments or more past due or in foreclosure".
 Click on graph for larger image
Mortgages in forbearance are being counted as delinquent in this monthly report, but they will not be reported to the credit bureaus.
This is very different from the increase in delinquencies following the housing bubble. Lending standards have been fairly solid over the last decade, and most of these homeowners have equity in their homes - and they will be able to restructure their loans once (if) they are employed.
Also - for multifamily - delinquencies were at 0.12%, down from 0.15% in July, and down from the peak of 0.20% in April 2021.
MBA Survey: "Share of Mortgage Loans in Forbearance Decreases to 2.96%"
by Calculated Risk on 9/27/2021 04:00:00 PM
Note: This is as of September 19th.
From the MBA: Share of Mortgage Loans in Forbearance Decreases to 2.96%
The Mortgage Bankers Association’s (MBA) latest Forbearance and Call Volume Survey revealed that the total number of loans now in forbearance decreased by 4 basis points from 3.00% of servicers’ portfolio volume in the prior week to 2.96% as of September 19, 2021. According to MBA’s estimate, 1.5 million homeowners are in forbearance plans.
The share of Fannie Mae and Freddie Mac loans in forbearance decreased 3 basis points to 1.44%. Ginnie Mae loans in forbearance increased 3 basis points to 3.42%, and the forbearance share for portfolio loans and private-label securities (PLS) decreased 4 basis points to 6.91%. The percentage of loans in forbearance for independent mortgage bank (IMB) servicers decreased 1 basis point relative to the prior week to 3.24%, and the percentage of loans in forbearance for depository servicers decreased 4 basis points to 3.06%.
“The share of loans in forbearance continued to decrease last week, dropping below 3 percent for the first time since March 2020,” said Mike Fratantoni, MBA’s Senior Vice President and Chief Economist. “However, there was a slight increase in the forbearance share for Ginnie Mae loans, and this increase was seen for both depository and IMB servicers. New forbearance requests and re-entries continue to run at a higher rate for Ginnie Mae loans as well as for portfolio and PLS loans, which include many delinquent FHA, VA, and USDA loans that have been bought out of Ginnie Mae pools.”
emphasis added
 Click on graph for larger image.
This graph shows the percent of portfolio in forbearance by investor type over time. Most of the increase was in late March and early April 2020, and has trended down since then.
The MBA notes: "Total weekly forbearance requests as a percent of servicing portfolio volume (#) remained the same relative to the prior week at 0.05%."
September 27th COVID-19: Data reported on Monday is always low, and will be revised up as data is received
by Calculated Risk on 9/27/2021 03:58:00 PM
The CDC is the source for all data.
According to the CDC, on Vaccinations. Total doses administered: 390,664,923, as of a week ago 386,237,881, or 0.63 million doses per day.
| COVID Metrics | ||||
|---|---|---|---|---|
| Today | Week Ago | Goal | ||
| Percent fully Vaccinated | 55.4% | 54.7% | ≥70.0%1 | |
| Fully Vaccinated (millions) | 183.9 | 181.7 | ≥2321 | |
| New Cases per Day3 | 95,228 | 134,500 | ≤5,0002 | |
| Hospitalized3 | 75,112 | 86,009 | ≤3,0002 | |
| Deaths per Day3 | 1,332 | 1,508 | ≤502 | |
| 1 Minimum to achieve "herd immunity" (estimated between 70% and 85%). 2my goals to stop daily posts, 37 day average for Cases, Currently Hospitalized, and Deaths 🚩 Increasing 7 day average week-over-week for Cases, Hospitalized, and Deaths ✅ Goal met. | ||||
IMPORTANT: For "herd immunity" most experts believe we need 70% to 85% of the total population fully vaccinated (or already had COVID).
KUDOS to the residents of the 13 states and D.C. that have achieved 60% of total population fully vaccinated: Vermont at 69.3%, Massachusetts, Maine, Connecticut, Rhode Island, Maryland. New Jersey, Washington, New York, New Mexico, New Hampshire, Oregon, Virginia, and District of Columbia at 60.0%.
The following 21 states have between 50% and 59.9% fully vaccinated: Colorado at 59.2%, California, Minnesota, Hawaii, Delaware, Pennsylvania, Wisconsin, Florida, Nebraska, Iowa, Illinois, Michigan, South Dakota, Kentucky, Arizona, Kansas, Texas, Nevada, Alaska, Utah and Ohio at 50.1%.
Next up (total population, fully vaccinated according to CDC) are North Carolina 49.6%, Indiana at 48.3% and Montana at 48.2%.
Click on graph for larger image.This graph shows the daily (columns) and 7 day average (line) of positive tests reported.
Mortgage Rates Increasing
by Calculated Risk on 9/27/2021 12:48:00 PM
Today, in the Newsletter: Mortgage Rates Increasing
Excerpt:
With the ten year yield close to 1.50%, and based on an historical relationship, 30-year rates should currently be around 3.4%.
Mortgage News Daily reports that the most prevalent 30 year fixed rate is now at 3.13% for top tier scenarios. So mortgage rates are a little lower than expected.
The graph shows the relationship between the monthly 10 year Treasury Yield and 30 year mortgage rates from the Freddie Mac survey.

Housing Inventory Sept 27th Update: Inventory Down Slightly Week-over-week, Up 41% from Low in early April
by Calculated Risk on 9/27/2021 10:41:00 AM
Tracking existing home inventory will be very important this year.
 Click on graph for larger image in graph gallery.
This inventory graph is courtesy of Altos Research.
As of September 24th, inventory was at 433 thousand (7 day average), compared to 568 thousand for the same week a year ago. That is a decline of 23.8%.
Compared to the same week in 2019, inventory is down 55% from 963 thousand.
A week ago, inventory was at 436 thousand, and was down 23.8% YoY. Three weeks ago inventory was at 437 thousand (the peak for the year so far).
Seasonally, inventory bottomed in April (usually inventory bottoms in January or February). Now inventory may be peaking for the year. Inventory was about 41.1% above the record low in early April.
Key question: Usually inventory peaks in the Summer, and then declines into the Fall. Will inventory follow the normal seasonal pattern, or will inventory continue to increase over the coming months? This will be important to watch for house prices and housing activity.
Mike Simonsen discusses this data regularly on Youtube.
Altos Research has also seen a significant pickup in price decreases - now well above the level of a year ago - but still below a normal rate for September.
Seven High Frequency Indicators for the Economy
by Calculated Risk on 9/27/2021 08:34:00 AM
These indicators are mostly for travel and entertainment. It will interesting to watch these sectors recover as the pandemic subsides.
The TSA is providing daily travel numbers.
This data is as of September 26th.
 Click on graph for larger image.
This data shows the 7-day average of daily total traveler throughput from the TSA for 2019 (Light Blue), 2020 (Blue) and 2021 (Red).
The dashed line is the percent of 2019 for the seven day average.
The 7-day average is down 24.5% from the same day in 2019 (75.5% of 2019). (Dashed line)
Note that the dashed line hit a pandemic high over the Labor Day weekend - probably due to leisure travel, but is now below pre-holiday levels.
The red line usually increases seasonally after Labor Day. But, so far, it appears business traffic is soft.
The second graph shows the 7-day average of the year-over-year change in diners as tabulated by OpenTable for the US and several selected cities.
IMPORTANT: OpenTable notes: "we’ve updated the data including downloadable dataset from January 1, 2021 onward to compare seated diners from 2021 to 2019, as opposed to year over year." Thanks!
 Thanks to OpenTable for providing this restaurant data:
This data is updated through September 25, 2021.
This data is "a sample of restaurants on the OpenTable network across all channels: online reservations, phone reservations, and walk-ins. For year-over-year comparisons by day, we compare to the same day of the week from the same week in the previous year."
Note that this data is for "only the restaurants that have chosen to reopen in a given market". Since some restaurants have not reopened, the actual year-over-year decline is worse than shown.
Dining picked up for the Labor Day weekend, but declined after the holiday. The 7-day average for the US is down 11% compared to 2019.
 This data shows domestic box office for each week and the median for the years 2016 through 2019 (dashed light blue).
 Blue is 2020 and Red is 2021.
The data is from BoxOfficeMojo through September 23rd.
Note that the data is usually noisy week-to-week and depends on when blockbusters are released.
Movie ticket sales were at $63 million last week, down only about 55% from the median for the week.
Note that the data is usually noisy week-to-week and depends on when blockbusters are released.
Movie ticket sales were at $63 million last week, down only about 55% from the median for the week.
 This graph shows the seasonal pattern for the hotel occupancy rate using the four week average.
 The red line is for 2021, black is 2020, blue is the median, dashed purple is 2019, and dashed light blue is for 2009 (the worst year on record for hotels prior to 2020).
This data is through September 18th. The occupancy rate was down 11.6% compared to the same week in 2019. The comparison to 2019 was difficult this week due to the timing of Labor Day.
Notes: Y-axis doesn't start at zero to better show the seasonal change.
With solid leisure travel, the Summer months had decent occupancy - but it is uncertain what will happen in the Fall with business travel - usually weekly occupancy increases to around 70% in the weeks following Labor Day due to renewed business travel.
----- Gasoline Supplied: Energy Information Administration -----
 This graph, based on weekly data from the U.S. Energy Information Administration (EIA), shows gasoline supplied compared to the same week of 2019.
Blue is for 2020. Red is for 2021.
As of September 10th, gasoline supplied was down 4.8% compared to the same week in 2019.
There have been five weeks so far this year when gasoline supplied was up compared to the same week in 2019.
----- Transit: Apple Mobility -----
This graph is from Apple mobility. From Apple: "This data is generated by counting the number of requests made to Apple Maps for directions in select countries/regions, sub-regions, and cities." This is just a general guide - people that regularly commute probably don't ask for directions.
There is also some great data on mobility from the Dallas Fed Mobility and Engagement Index. However the index is set "relative to its weekday-specific average over January–February", and is not seasonally adjusted, so we can't tell if an increase in mobility is due to recovery or just the normal increase in the Spring and Summer.
 This data is through September 25th for the United States and several selected cities.
The graph is the running 7-day average to remove the impact of weekends.
IMPORTANT: All data is relative to January 13, 2020. This data is NOT Seasonally Adjusted. People walk and drive more when the weather is nice, so I'm just using the transit data.
According to the Apple data directions requests, public transit in the 7 day average for the US is at 119% of the January 2020 level.
 This graph, based on weekly data from the U.S. Energy Information Administration (EIA), shows gasoline supplied compared to the same week of 2019.
Blue is for 2020. Red is for 2021.
As of September 10th, gasoline supplied was down 4.8% compared to the same week in 2019.
There have been five weeks so far this year when gasoline supplied was up compared to the same week in 2019.
This graph is from Apple mobility. From Apple: "This data is generated by counting the number of requests made to Apple Maps for directions in select countries/regions, sub-regions, and cities." This is just a general guide - people that regularly commute probably don't ask for directions.
There is also some great data on mobility from the Dallas Fed Mobility and Engagement Index. However the index is set "relative to its weekday-specific average over January–February", and is not seasonally adjusted, so we can't tell if an increase in mobility is due to recovery or just the normal increase in the Spring and Summer.
 This data is through September 25th for the United States and several selected cities.
The graph is the running 7-day average to remove the impact of weekends.
IMPORTANT: All data is relative to January 13, 2020. This data is NOT Seasonally Adjusted. People walk and drive more when the weather is nice, so I'm just using the transit data.
According to the Apple data directions requests, public transit in the 7 day average for the US is at 119% of the January 2020 level.
New York City is doing well by this metric, but subway usage in NYC is down sharply (next graph).
----- New York City Subway Usage -----
Here is some interesting data on New York subway usage (HT BR).
 This graph is from Todd W Schneider. This is weekly data since 2015.
Here is some interesting data on New York subway usage (HT BR).
 This graph is from Todd W Schneider. This is weekly data since 2015.
 Most weeks are between 30 and 35 million entries, and currently there are clsoe to 15 million subway turnstile entries per week - and moving up recently.
This data is through Friday, September 24th.
Schneider has graphs for each borough, and links to all the data sources.
He notes: "Data updates weekly from the MTA’s public turnstile data, usually on Saturday mornings".
This data is through Friday, September 24th.
Schneider has graphs for each borough, and links to all the data sources.
He notes: "Data updates weekly from the MTA’s public turnstile data, usually on Saturday mornings".
Sunday, September 26, 2021
Sunday Night Futures
by Calculated Risk on 9/26/2021 07:10:00 PM
Weekend:
• Schedule for Week of September 26, 2021
• The Home ATM
Monday:
• 8:30 AM ET, Durable Goods Orders for August from the Census Bureau. The consensus is for a 0.7% increase in durable goods orders.
• 10:30 AM, Dallas Fed Survey of Manufacturing Activity for September.
From CNBC: Pre-Market Data and Bloomberg futures S&P 500 are up 7 and DOW futures are up 92 (fair value).
Oil prices were up over the last week with WTI futures at $74.53 per barrel and Brent at $78.55 per barrel. A year ago, WTI was at $40, and Brent was at $41 - so WTI oil prices are UP 90% year-over-year (oil prices collapsed at the beginning of the pandemic).
Here is a graph from Gasbuddy.com for nationwide gasoline prices. Nationally prices are at $3.18 per gallon. A year ago prices were at $2.18 per gallon, so gasoline prices are up $1.00 per gallon year-over-year.
The Home ATM, aka Mortgage Equity Withdrawal (MEW)
by Calculated Risk on 9/26/2021 04:06:00 PM
In the Newsletter I have The Home ATM
Excerpt:
In Q2 2021, mortgage debt increased $223 billion, the largest quarterly increase since 2006.
...
The bottom line is the recent increase in MEW is not concerning - it is far less as a percent of disposable personal income than during the bubble, and most homeowners have substantial equity.

Saturday, September 25, 2021
Newsletter Articles this Week
by Calculated Risk on 9/25/2021 02:11:00 PM
At the Calculated Risk Newsletter this week:
• Comments on August New Home Sales; Record 105 thousand homes have not been started
• Existing Homes: Some Regional Differences Appear; Final August Update for Local Housing Markets
• Existing-Home Sales Decreased to 5.88 million in August; Sales will be down year-over-year for the remainder of 2021
• Housing Starts increased to 1.615 Million Annual Rate in August; Most Multi-Family Units Under Construction Since 1974
This will usually be published several times a week, and will provide more in-depth analysis of the housing market.
The blog will continue as always!
You can subscribe at https://calculatedrisk.substack.com/ (Currently all content is available for free, but please subscribe).
You can subscribe at https://calculatedrisk.substack.com/ (Currently all content is available for free, but please subscribe).
Schedule for Week of September 26, 2021
by Calculated Risk on 9/25/2021 08:11:00 AM
The key reports this week are the third estimate of Q2 GDP, the September ISM manufacturing index, September auto sales, Personal Income and Outlays for August and Case-Shiller house prices for July.
For manufacturing, the Richmond and Kansas City Fed manufacturing surveys will be released this week.
Fed Chair Powell testifies on Coronavirus and CARES Act this week.
8:30 AM: Durable Goods Orders for August from the Census Bureau. The consensus is for a 0.7% increase in durable goods orders.
10:30 AM: Dallas Fed Survey of Manufacturing Activity for September.
9:00 AM: FHFA House Price Index for July. This was originally a GSE only repeat sales, however there is also an expanded index.
 9:00 AM: S&P/Case-Shiller House Price Index for July.
This graph shows the year-over-year change in the seasonally adjusted National Index, Composite 10 and Composite 20 indexes through the most recent report (the Composite 20 was started in January 2000).
The consensus is for a 20.0% year-over-year increase in the Comp 20 index for July.
10:00 AM: the Richmond Fed manufacturing survey for September. This is the last of the regional surveys for September.
10:00 AM, Testimony, Fed Chair Powell, Coronavirus and CARES Act, Before the U.S. Senate Committee on Banking, Housing, and Urban Affairs
7:00 AM ET: The Mortgage Bankers Association (MBA) will release the results for the mortgage purchase applications index.
10:00 AM: Pending Home Sales Index for August. The consensus is 1.3% increase in the index.
11:45 AM: Discussion, Fed Chair Powell, Policy Panel Discussion, At the European Central Bank Forum on Central Banking
8:30 AM: The initial weekly unemployment claims report will be released. The consensus is for 335 thousand initial claims, down from 351 thousand last week.
8:30 AM: Gross Domestic Product, 2nd quarter 2021 (Third estimate). The consensus is that real GDP increased 6.7% annualized in Q2, revised up from the second estimate of 6.6%.
9:45 AM: Chicago Purchasing Managers Index for September. The consensus is for a reading of 65.0, down from 66.8 in August.
8:30 AM: Personal Income and Outlays for August. The consensus is for a 0.3% increase in personal income, and for a 0.6% increase in personal spending. And for the Core PCE price index to increase 0.2%.
10:00 AM: ISM Manufacturing Index for September. The consensus is for a reading of 59.5, down from 59.9 in August.
10:00 AM: Construction Spending for August. The consensus is for a 0.3% increase.
 All day: Light vehicle sales for September.
The consensus is for sales of 13.4 million SAAR, up from 13.1 million SAAR in August (Seasonally Adjusted Annual Rate).
This graph shows light vehicle sales since the BEA started keeping data in 1967. The dashed line is the current sales rate.
Friday, September 24, 2021
Black Knight: Number of Homeowners in COVID-19-Related Forbearance Plans Declined Slightly
by Calculated Risk on 9/24/2021 04:18:00 PM
Note: Both Black Knight and the MBA (Mortgage Bankers Association) are putting out weekly estimates of mortgages in forbearance.
This data is as of September 21st.
From Andy Walden at Black Knight: Little Movement in Forbearance Volumes This Week
The number of active forbearance plans fell by 18,000 (-1.4%) this week, leaving 1.58 million U.S. homeowners in COVID-19 forbearance as of September [21].
Declines of 11,000 and 10,000 among FHA/VA and GSE loans respectively were partially offset by a 3,000 rise in PLS/portfolio plans. Overall, forbearances are now down 182,000 (-10%) from the same time last month, with the strongest decline (-13%) seen among GSE plans.
The population of mortgage holders in COVID-19 related forbearance plans represents 3% of all active mortgages, including 1.7% of GSE, 5.2% of FHA/VA and 3.8% of portfolio held and privately securitized loans.
In terms of forbearance plan starts, 15,000 new plans were initiated since last Tuesday – down slightly from last week’s 16,000 starts – while 34,000 plans were restarted, compared to last week’s volume of 35,000. Meanwhile, in typical mid-month behavior, plan exits dipped slightly this week, but are expected to ramp up in coming weeks.
Click on graph for larger image.
More than 460,000 plans are still slated for review for extension/removal over the final week of September, with some 300,000 set to reach their final expirations based on current allowable forbearance term lengths. This could lead to significant movement in volumes entering early October.
emphasis added

September 24th COVID-19: 7-Day Average Cases off 27% from Recent Peak
by Calculated Risk on 9/24/2021 04:13:00 PM
The CDC is the source for all data.
According to the CDC, on Vaccinations. Total doses administered: 388,567,109, as of a week ago 383,994,877, or 0.65 million doses per day.
| COVID Metrics | ||||
|---|---|---|---|---|
| Today | Week Ago | Goal | ||
| Percent fully Vaccinated | 55.1% | 54.4% | ≥70.0%1 | |
| Fully Vaccinated (millions) | 183.0 | 180.6 | ≥2321 | |
| New Cases per Day3 | 117,066 | 142,885 | ≤5,0002 | |
| Hospitalized3 | 80,957 | 89,248 | ≤3,0002 | |
| Deaths per Day3🚩 | 1,559 | 1,553 | ≤502 | |
| 1 Minimum to achieve "herd immunity" (estimated between 70% and 85%). 2my goals to stop daily posts, 37 day average for Cases, Currently Hospitalized, and Deaths 🚩 Increasing 7 day average week-over-week for Cases, Hospitalized, and Deaths ✅ Goal met. | ||||
IMPORTANT: For "herd immunity" most experts believe we need 70% to 85% of the total population fully vaccinated (or already had COVID).
KUDOS to the residents of the 13 states that have achieved 60% of total population fully vaccinated: Vermont at 69.2%, Connecticut, Maine, Rhode Island, Massachusetts, New Jersey, Maryland, New York, New Mexico, New Hampshire, Oregon, Washington, and Virginia at 60.0%.
The following 19 states and D.C. have between 50% and 59.9% fully vaccinated: District of Columbia at 59.6%, Colorado, California, Minnesota, Hawaii, Pennsylvania, Delaware, Florida, Wisconsin, Nebraska, Iowa, Illinois, Michigan, Kentucky, South Dakota, Texas, Arizona, Kansas, Nevada, and Utah at 50.2%.
Next up (total population, fully vaccinated according to CDC) are Ohio at 49.9%, Alaska at 49.7%, North Carolina 49.2%, Indiana at 48.1% and Montana at 48.1%.
 Click on graph for larger image.
This graph shows the daily (columns) and 7 day average (line) of positive tests reported.
Q3 GDP Forecasts: Around 4.5%
by Calculated Risk on 9/24/2021 12:32:00 PM
GDP forecasts had been downgraded sharply for Q3 due to COVID, but now seem to have stabilized.
Here is a table of some of the forecasts over the last two months.
| Merrill | Goldman | GDPNow | |
|---|---|---|---|
| 7/30/21 | 7.0% | 9.0% | 6.1% |
| 8/20/21 | 4.5% | 5.5% | 6.1% |
| 9/10/21 | 4.5% | 3.5% | 3.7% |
| 9/17/21 | 4.5% | 4.5% | 3.6% |
| 9/24/21 | 4.5% | 4.5% | 3.7% |
From BofA Merrill Lynch:
We continue to track 4.5% qoq saar for 3Q GDP. [Sept 24 estimate]From Goldman Sachs:
emphasis added
We left our Q3 GDP tracking estimate unchanged at +4.5% (qoq ar). [Sept 24 estimate]And from the Altanta Fed: GDPNow
The GDPNow model estimate for real GDP growth (seasonally adjusted annual rate) in the third quarter of 2021 is 3.7 percent on September 21, up from 3.6 percent on September 16. [Sept 21 estimate]
Comments on August New Home Sales
by Calculated Risk on 9/24/2021 11:02:00 AM
In the Newsletter I have Comments on August New Home Sales
Excerpt:
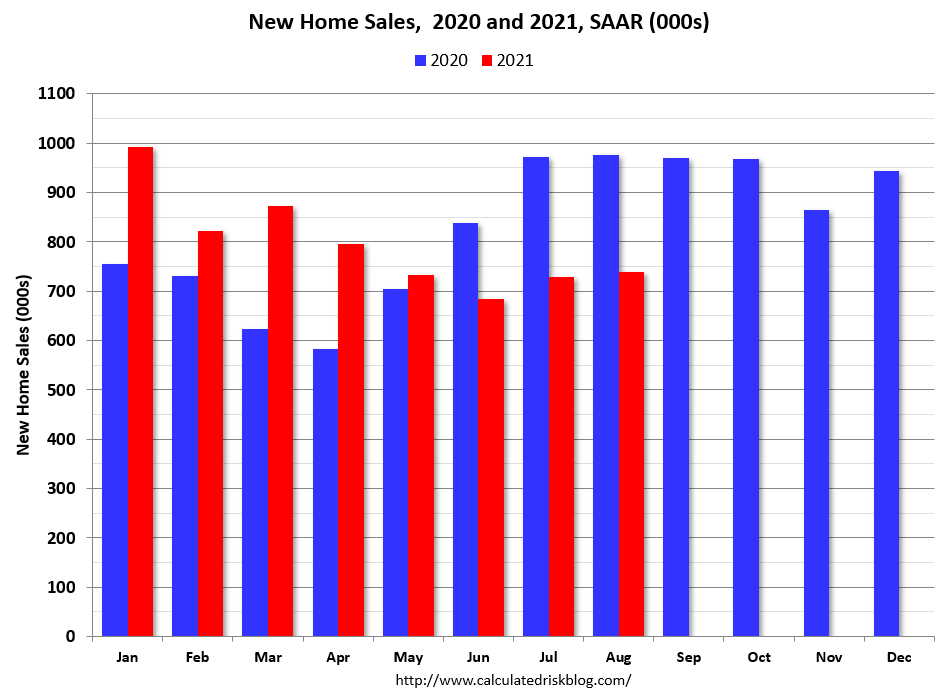
Sales, year to date in 2021, are only 2.4% ahead of sales in 20202, and new home sales in 2021 will be below sales in 2020 - since sales in 2020 finished strong.
This graph shows new home sales for 2020 and 2021 by month (Seasonally Adjusted Annual Rate).
New Home Sales Increase to 740,000 Annual Rate in August
by Calculated Risk on 9/24/2021 10:10:00 AM
The Census Bureau reports New Home Sales in August were at a seasonally adjusted annual rate (SAAR) of 740 thousand.
The previous three months were revised up, combined.
Sales of new single‐family houses in August 2021 were at a seasonally adjusted annual rate of 740,000, according to estimates released jointly today by the U.S. Census Bureau and the Department of Housing and Urban Development. This is 1.5 percent above the revised July rate of 729,000, but is 24.3 percent below the August 2020 estimate of 977,000.
emphasis added
 Click on graph for larger image.
The first graph shows New Home Sales vs. recessions since 1963. The dashed line is the current sales rate.
New home sales are now declining year-over-year since sales soared following the first few months of the pandemic.
The second graph shows New Home Months of Supply.
 The months of supply increased in August to 6.1 months from 6.0 months in July.
 The all time record high was 12.1 months of supply in January 2009. The all time record low was 3.5 months, most recently in October 2020.
This is above the normal range (about 4 to 6 months supply is normal).
"The seasonally‐adjusted estimate of new houses for sale at the end of August was 378,000. This represents a supply of 6.1 months at the current sales rate."
 The last graph shows sales NSA (monthly sales, not seasonally adjusted annual rate).
In August 2021 (red column), 62 thousand new homes were sold (NSA). Last year, 81 thousand homes were sold in August.
The all time high for August was 110 thousand in 2005, and the all time low for August was 23 thousand in 2010.
This was above expectations of 714 thousand SAAR and sales in the three previous months were revised up, combined. I'll have more later today.
September Vehicle Sales Forecast: "Disappearing Inventory Taking U.S. Light-Vehicle Sales to Another Low in September"
by Calculated Risk on 9/24/2021 07:57:00 AM
From WardsAuto: Disappearing Inventory Taking U.S. Light-Vehicle Sales to Another Low in September (pay content)
Low inventories and supply issues continue to impacting vehicle sales.
 Click on graph for larger image.
This graph shows actual sales from the BEA (Blue), and Wards forecast for September (Red).
The Wards forecast of 12.4 million SAAR, would be down about 5% from last month, and down 23.8% from a year ago (sales were solid in September 2020, as sales recovered from the depths of the pandemic).
Thursday, September 23, 2021
Friday: New Home Sales
by Calculated Risk on 9/23/2021 09:38:00 PM
Friday:
• At 10:00 AM ET, New Home Sales for August from the Census Bureau. The consensus is for 714 thousand SAAR, up from 708 thousand in July.
• Also at 10:00 AM, Opening Remarks, Fed Chair Jerome Powell, At Fed Listens: Perspectives on the Pandemic Recovery
September 23rd COVID-19: 55% of Americans Fully Vaccinated
by Calculated Risk on 9/23/2021 09:36:00 PM
The CDC is the source for all data.
According to the CDC, on Vaccinations. Total doses administered: 387,821,704, as of a week ago 383,038,403, or 0.68 million doses per day.
| COVID Metrics | ||||
|---|---|---|---|---|
| Today | Week Ago | Goal | ||
| Percent fully Vaccinated | 55.0% | 54.2% | ≥70.0%1 | |
| Fully Vaccinated (millions) | 182.6 | 180.1 | ≥2321 | |
| New Cases per Day3 | 121,532 | 146,684 | ≤5,0002 | |
| Hospitalized3 | 81,373 | 90,243 | ≤3,0002 | |
| Deaths per Day3🚩 | 1,556 | 1,545 | ≤502 | |
| 1 Minimum to achieve "herd immunity" (estimated between 70% and 85%). 2my goals to stop daily posts, 37 day average for Cases, Currently Hospitalized, and Deaths 🚩 Increasing 7 day average week-over-week for Cases, Hospitalized, and Deaths ✅ Goal met. | ||||
IMPORTANT: For "herd immunity" most experts believe we need 70% to 85% of the total population fully vaccinated (or already had COVID).
KUDOS to the residents of the 12 states that have achieved 60% of total population fully vaccinated: Vermont at 69.1%, Massachusetts, Maine, Connecticut, Rhode Island, Maryland. New Jersey, Washington, New York, New Mexico, New Hampshire and Oregon at 60.2%.
The following 20 states and D.C. have between 50% and 59.9% fully vaccinated: Virginia at 59.8%, District of Columbia, Colorado, California, Minnesota, Hawaii, Delaware, Pennsylvania, Wisconsin, Florida, Nebraska, Iowa, Illinois, Michigan, South Dakota, Kentucky, Arizona, Kansas, Texas, Nevada, and Utah at 50.0%.
Next up (total population, fully vaccinated according to CDC) are Ohio at 49.8%, Alaska at 49.7%, North Carolina 49.0% and Montana at 48.1%.
 Click on graph for larger image.
This graph shows the daily (columns) and 7 day average (line) of positive tests reported.
Existing Home Sales: Some Regional Differences Appear
by Calculated Risk on 9/23/2021 04:26:00 PM
In the Newsletter I have Existing Home Sales: Some Regional Differences Appear
Excerpt:
For the last year, most housing markets moved together with rapidly falling inventory and sharply increasing house prices. However, in August, about half of these markets saw a month-over-month (MoM) increase in inventory - and the other half saw a decrease - so we might be seeing some regional divergence.


In Memoriam: Doris "Tanta" Dungey


| Privacy Policy |
| Copyright © 2007 - 2025 CR4RE LLC |
| Excerpts NOT allowed on x.com |