 RSS Feed
 by Calculated Risk on 8/23/2021 10:11:00 AM
Monday, August 23, 2021
NAR: Existing-Home Sales Increased to 5.99 million in July
From the NAR: Existing-Home Sales Climb 2.0% in July
Existing-home sales rose in July, marking two consecutive months of increases, according to the National Association of Realtors®. Three of the four major U.S. regions recorded modest month-over-month gains, and the fourth remained level. Figures varied from a year-over-year perspective as two regions saw gains, one witnessed a decline and one was unchanged.
Total existing-home sales, completed transactions that include single-family homes, townhomes, condominiums and co-ops, grew 2.0% from June to a seasonally adjusted annual rate of 5.99 million in July. Sales inched up year-over-year, increasing 1.5% from a year ago (5.90 million in July 2020).
...
Total housing inventory at the end of July totaled 1.32 million units, up 7.3% from June's supply and down 12.0% from one year ago (1.50 million). Unsold inventory sits at a 2.6-month supply at the present sales pace, up slightly from the 2.5-month figure recorded in June but down from 3.1 months in July 2020.
emphasis added
 Click on graph for larger image.
This graph shows existing home sales, on a Seasonally Adjusted Annual Rate (SAAR) basis since 1993.
Sales in July (5.99 million SAAR) were up 2.0% from last month, and were 1.5% above the July 2020 sales rate.
The second graph shows nationwide inventory for existing homes.
 According to the NAR, inventory increased to 1.32 million in July from 1.23 million in June.
Headline inventory is not seasonally adjusted, and inventory usually decreases to the seasonal lows in December and January, and peaks in mid-to-late summer.
The last graph shows the year-over-year (YoY) change in reported existing home inventory and months-of-supply. Since inventory is not seasonally adjusted, it really helps to look at the YoY change. Note: Months-of-supply is based on the seasonally adjusted sales and not seasonally adjusted inventory.
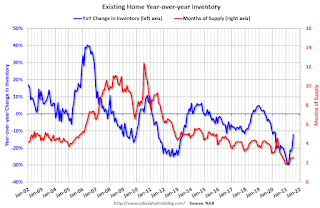 Inventory was down 12.0% year-over-year in July compared to July 2020.
Months of supply increased to 2.6 months in July from 2.5 months in June.
This was slightly above the consensus forecast. I'll have more later.
The last graph shows the year-over-year (YoY) change in reported existing home inventory and months-of-supply. Since inventory is not seasonally adjusted, it really helps to look at the YoY change. Note: Months-of-supply is based on the seasonally adjusted sales and not seasonally adjusted inventory.
 Inventory was down 12.0% year-over-year in July compared to July 2020.
 Months of supply increased to 2.6 months in July from 2.5 months in June.
This was slightly above the consensus forecast. I'll have more later.


