 RSS Feed
 by Calculated Risk on 3/27/2021 08:11:00 AM
Saturday, March 27, 2021
Schedule for Week of March 28, 2021
The key report scheduled for this week is the March employment report on Friday.
Other key reports include January Case-Shiller house prices and March Auto Sales.
For manufacturing, the March Dallas Fed survey and the ISM Manufacturing survey will be released.
10:30 AM: Dallas Fed Survey of Manufacturing Activity for March. This is the last of the regional surveys for March.
 9:00 AM: S&P/Case-Shiller House Price Index for January.
This graph shows the year-over-year change for the Case-Shiller National, Composite 10 and Composite 20 indexes, through the most recent report (the Composite 20 was started in January 2000).
The consensus is for a 10.7% year-over-year increase in the Comp 20 index.
9:00 AM: FHFA House Price Index for January 2021. This was originally a GSE only repeat sales, however there is also an expanded index.
7:00 AM ET: The Mortgage Bankers Association (MBA) will release the results for the mortgage purchase applications index.
8:15 AM: The ADP Employment Report for March. This report is for private payrolls only (no government). The consensus is for 550,000 payroll jobs added in March, up from 117,000 added in February.
9:45 AM: Chicago Purchasing Managers Index for March. The consensus is for a reading of 60.3, up from 59.5 in February.
10:00 AM: Pending Home Sales Index for February. The consensus is for a 2.6% decrease in the index.
8:30 AM: The initial weekly unemployment claims report will be released. The consensus is for a decrease to 650 thousand from 684 thousand last week.
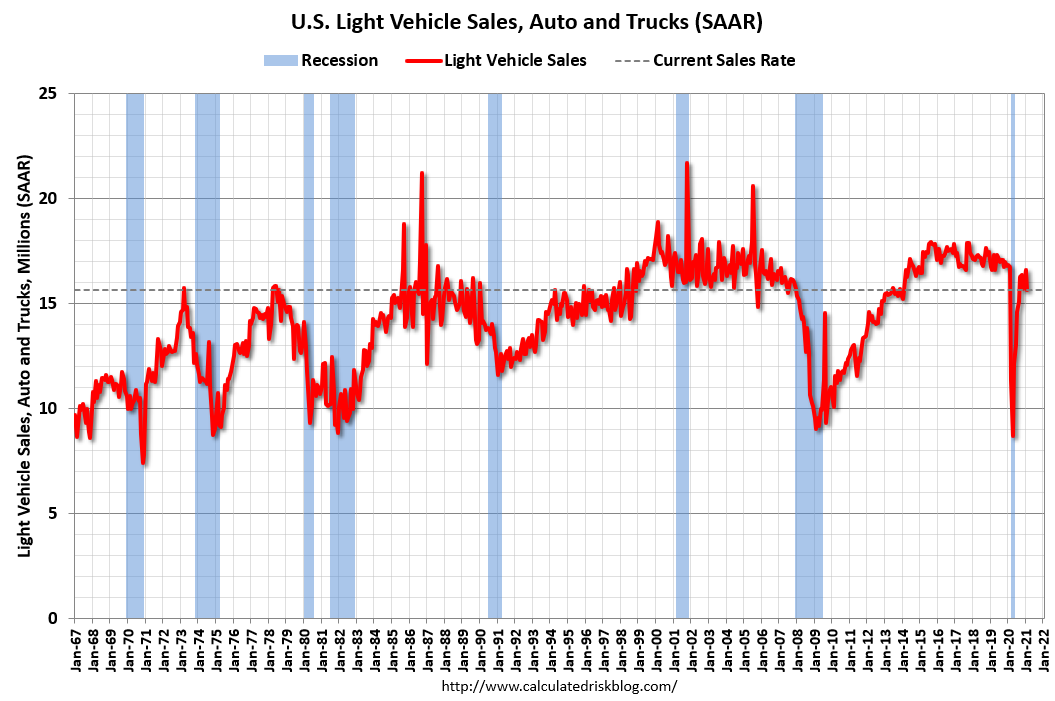 All Day: Light vehicle sales for March. The consensus is for light vehicle sales to be 16.5 million SAAR in March, up from 15.7 million in February (Seasonally Adjusted Annual Rate).
This graph shows light vehicle sales since the BEA started keeping data in 1967. The dashed line is the February sales rate.
10:00 AM: ISM Manufacturing Index for March. The consensus is for the ISM to be at 61.2, up from 60.8 in February.
10:00 AM: Construction Spending for February. The consensus is for a 0.9% decrease in construction spending.
 8:30 AM: Employment Report for February. The consensus is for 565,000 jobs added, and for the unemployment rate to decrease to 6.0%.
There were 379,000 jobs added in February, and the unemployment rate was at 6.2%.
This graph shows the job losses from the start of the employment recession, in percentage terms.
The current employment recession was by far the worst recession since WWII in percentage terms, and is still at the worst of the "Great Recession".


