by Calculated Risk on 5/09/2020 12:58:00 PM
Saturday, May 09, 2020
Recession Measures and NBER
Calling the beginning or end of a recession takes time. The National Bureau of Economic Research (NBER) waits until the data is revised, and if the recovery is sluggish, this process can take from 18 months to two years or longer.
In addition, if the economy slides into recession again, the committee will only consider it a new recession if most major indicators were close to or above their previous highs. Otherwise it will just be considered a continuation of the previous recession.
A good example of the NBER calling two separate recessions was in the early '80s, from the NBER memo:
"The period following July 1980 will appear in the NBER chronology as an expansion. An important factor influencing that decision is that most major indicators, including real GNP, are already close to or above their previous highs."It will take some time for most major indicators to be above their previous high after the current recession because of the severe contraction as the graphs below show.
emphasis added
GDP is the key measure, as the NBER committee notes in their business cycle dating procedure:
The committee views real GDP as the single best measure of aggregate economic activity.
 Click on graph for larger image.
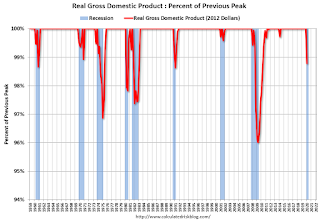
This graph is for real GDP through Q1 2020. Real GDP returned to the pre-recession peak in Q3 2011, and has been at new post recession highs for almost a decade.
This is the key measure, and the NBER will probably use GDP and GDI to determine the trough of the recession.
Real GDP is only 1.2% below the pre-recession peak - however real GDP is expected to decline another 7% to 8% in Q2 (A much larger decline than the Great Recession).
 The second graph is for monthly industrial production based on data from the Federal Reserve through Mar 2020.
Industrial production declined much further in April (to be released this coming week).
Industrial production usually takes a long time to recover after a significant decline.
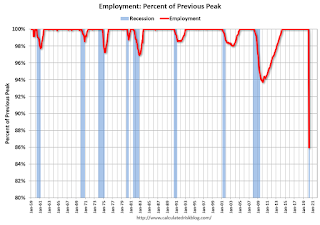
 The third graph is for employment through April 2020.
Employment will decline much further in May.
Historically employment was a coincident indicator for the end of recessions, but that hasn't been true for the previous three recessions (1990-1991, 2001, 2007-2009).
It is likely that employment will not recover to pre-recession levels for a long time.
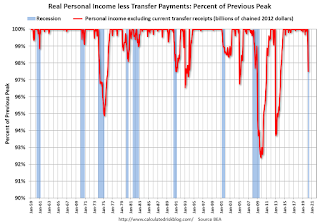
 And the last graph is for real personal income excluding transfer payments through Mar 2020.
Once again it will take a long time to return to pre-recession levels.
These graphs are useful in trying to identify peaks and troughs in economic activity.
My guess is that economic activity will bottom in Q2 (maybe already in April), but the pace of the recovery will depend on the course of the virus.


