by Calculated Risk on 5/04/2020 07:00:00 AM
Monday, May 04, 2020
Black Knight Mortgage Monitor for March; Discussion of Forbearance Plans
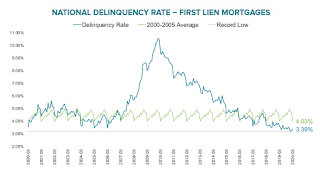
Black Knight released their Mortgage Monitor report for March today. According to Black Knight, 3.39% of mortgages were delinquent in March, down from 3.65% in March 2019. Black Knight also reported that 0.42% of mortgages were in the foreclosure process, down from 0.51% a year ago.
This gives a total of 3.81% delinquent or in foreclosure.
Press Release: Black Knight: Inflow of New COVID-19 Forbearance Plans Declines Following 15th of April; Additional Surge Likely as May Payments Approach
Today, the Data & Analytics division of Black Knight, Inc. released its latest Mortgage Monitor Report, based upon the company’s industry-leading mortgage performance, housing and public records datasets. As the economic impact of COVID-19 continues, Black Knight looked this month at key indicators of mortgage performance and daily forbearance activity, as well as the effects of the pandemic on interest rates and the housing market. As Black Knight Data & Analytics President Ben Graboske explained, the rate at which American homeowners have been seeking mortgage forbearances began to slow from the middle of April forward, and Black Knight will monitor this trend to see if it continues.
“After surging at the beginning of April and then rising again near the 15th – when most mortgages become past due and late fees are charged – the number of new forbearance requests has declined in recent weeks,” said Graboske. “While total forbearance volumes continue to mount, daily inflow has begun to taper off. Between 53,000 and 102,000 new plans have been put into place over each of the last nine days, and even the largest single-day volume was less than a quarter of what we saw at the start of April – and may see again next week. What remains an open question at this point is to what degree forbearance requests will look like at the beginning of May – when the next round of mortgage payments become due, and with nearly 30 million Americans newly unemployed in the last month. Once we have a sense for whether there is a similar spike in forbearance requests around the beginning of May, we’ll be in a much better position to more accurately forecast possible scenarios.
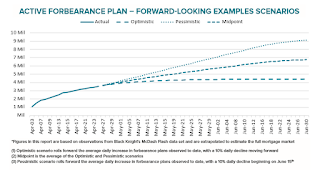
“As it is, in an optimistic scenario in which daily forbearance volumes continue to decline by 10% per day, the number of forbearances could peak at approximately 4.5 million in the coming months. Should current forbearance volumes hold steady through mid-June, more than 8 million homeowners could enter into forbearance plans, representing 16% or more of all mortgages. If that adverse scenario holds true, servicers would be required to advance $4 billion in monthly principal and interest (P&I) payments on GSE mortgages alone. Even under the FHFA’s recent four-month limit on P&I advances, servicers would still be bound to make $16 billion in advance payments over that time span.”
The month’s Mortgage Monitor report also looked at March prepayment activity, which surged to a near seven-year high. However, that was prior to the fallout from COVID-19 and the associated rise in unemployment and economic uncertainty. After rising in late March, 30-year interest rates fell back near record lows by mid-April. Rate lock data – a leading indicator of refinance and prepayment activity – suggests a steep decline in demand for refinancing. As of April 13, the average conventional 30-year note rate fell below 3.3% according to Black Knight’s Compass Analytics data – roughly equivalent to where it was in early March – but refinance-related rate locks saw little movement. In fact, refi locks were nearly 80% below their early-March peaks.
emphasis added
 Click on graph for larger image.
Here is a graph from the Mortgage Monitor that shows the National Delinquency Rate.
From Black Knight:
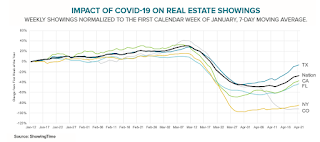
• In what’s typically the strongest month of the year for mortgage performance, March delinquencies rose by 3.33%The second graph shows the impact of COVID-19 on real estate showings:
• This the first March increase since the turn of the century – including the years of the Great Recession, and an early sign of COVID-19’s impact on the market
• In fact, March has historically seen delinquencies fall by 10% on average

• After falling as much as 63% below last year’s pace, in-person real estate showings began to pick up a bit beginning in the 3rd week of AprilThe third graph shows possible scenarios for the number of forbearance plans:
• Though a significant improvement, in-person real estate showings are still down 43% from the same time last year nationally
• In New York and Colorado – the latter of which has banned real estate showings as part of its shelter-in-place policy – in-person showings remain down 87% and 94% year-over-year respectively
• In Texas, showings are down by only 22% from the prior year, roughly half the decline being seen at the national level

• In an optimistic scenario in which daily forbearance volumes continue to decline by 10% per day, the number of forbearances could peak at approximately 4.5M in the coming monthsThere is much more in the mortgage monitor.
• Should current forbearance volumes hold steady through mid-June, more than 8M homeowners could enter into forbearance plans, representing 16% or more of all mortgages
• If that adverse scenario holds true, servicers would be required to advance $4 billion in monthly principal and interest payments on GSE mortgages alone
• Even under the FHFA’s recent four-month limit on principal and interest (P&I advances), servicers would still be bound to make $16 billion in advance payments over that time span


