by Calculated Risk on 4/03/2020 03:31:00 PM
Friday, April 03, 2020
AAR: March Rail Carloads down 6.0% YoY, Intermodal Down 12.2% YoY
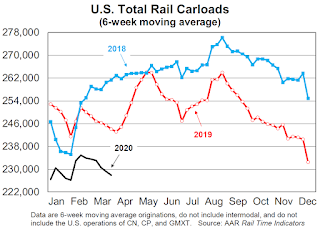
Note: The graphs are six week averages, and the economy was very different at the end of March - so next month we will see a sharp decline in traffic due to COVID-19.
From the Association of American Railroads (AAR) Rail Time Indicators. Graphs and excerpts reprinted with permission.
A confluence of factors caused weekly average U.S. rail carloads in March 2020 to fall to their lowest level since sometime before January 1988, when our data begin. Total U.S. carloads in March 2020 were down 6.0% from March 2019 and down 3.0% from February 2020. Meanwhile, U.S. intermodal volume in March 2020 was down 12.2% from March 2019 (its biggest year-over-year percentage decline since September 2009) and down 6.3% from February 2020.
The clearest example so far of the impact of the coronavirus on rail volumes involves autos and auto parts: combined U.S., Canadian, and Mexican carloads were 25,518 in the third week of March, but only 9,745 carloads — a 62% decline — the following week, thanks to widespread auto plant shutdowns. Intermodal also suffered from fewer containers of auto parts.
emphasis added
 Click on graph for larger image.
This graph from the Rail Time Indicators report shows the six week average of U.S. Carloads in 2018, 2019 and 2020:
The U.S. economy in the last week of March was very different from what it was in the first week of March. It’s the same with some rail commodities.
Total originated carloads on U.S. railroads in March 2020 were 57,148 carloads, or 6.0%, lower than in March 2019. That’s their 14th consecutive year-overyear decline. Total carloads averaged 224,918 per week in March 2020, supplanting February 2020 as the lowest-volume month since sometime prior to January 1988, when our data begin.
 The second graph shows the six week average of U.S. intermodal in 2018, 2019 and 2020: (using intermodal or shipping containers):
U.S. intermodal originations fell 12.2% in March 2020 from March 2019, their biggest year-over- year percentage decline since September 2009. Weekly average intermodal volume in March 2020 (233,845 units) was the lowest for March since 2013. What happens at Western ports will have a big impact on intermodal. Some say China is returning to normal, removing a supply shock that reduced sailings to the U.S and related intermodal shipments. However, some analysts fear that a demand shock is coming as U.S. importers cancel shipments because they don’t think they’ll be able to sell them. The only sure thing is that nobody knows for sure what’s going to happen.


