by Calculated Risk on 12/28/2019 08:11:00 AM
Saturday, December 28, 2019
Schedule for Week of December 29, 2019
Happy New Year! Wishing you all the best in 2020.
The key indicators include this week are Case-Shiller House Prices for October and the December ISM manufacturing index.
9:45 AM: Chicago Purchasing Managers Index for December.
10:00 AM: Pending Home Sales Index for November. The consensus is for a 1.1% increase in the index.
10:30 AM: Dallas Fed Survey of Manufacturing Activity for December. This is the last of regional manufacturing surveys for December.
9:00 AM: FHFA House Price Index for October 2019. This was originally a GSE only repeat sales, however there is also an expanded index.
 9:00 AM ET: S&P/Case-Shiller House Price Index for October.
This graph shows graph shows the Year over year change in the seasonally adjusted National Index, Composite 10 and Composite 20 indexes through the most recent report (the Composite 20 was started in January 2000).
The consensus is for a 3.2% year-over-year increase in the National index for October.
All US markets will be closed in observance of the New Year's Day Holiday.
8:30 AM: The initial weekly unemployment claims report will be released. The consensus is for 227,000 initial claims, up from 222,000 last week.
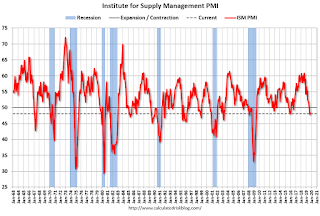
 10:00 AM: ISM Manufacturing Index for December. The consensus is for the ISM to be at 49.0, up from 48.1 in November.
Here is a long term graph of the ISM manufacturing index.
The PMI was at 48.1% in November, the employment index was at 46.6%, and the new orders index was at 47.2%.
10:00 AM: Construction Spending for November. The consensus is for a 0.3% increase in construction spending.
 All day: Light vehicle sales for December. The consensus is for light vehicle sales to be 17.0 million SAAR in December, down from 17.1 million in November (Seasonally Adjusted Annual Rate).
This graph shows light vehicle sales since the BEA started keeping data in 1967. The dashed line is the November sales rate.


