by Calculated Risk on 8/05/2019 08:30:00 AM
Monday, August 05, 2019
Black Knight Mortgage Monitor for June: Increase in Delinquencies due to Timing and Seasonal Factors
Black Knight released their Mortgage Monitor report for June today. According to Black Knight, 3.73% of mortgages were delinquent in June, down slightly from 3.74% in June 2018. Black Knight also reported that 0.50% of mortgages were in the foreclosure process, down from 0.56% a year ago.
This gives a total of 4.23% delinquent or in foreclosure.
Press Release: Black Knight Mortgage Monitor: Affordability Improves on Rate Drops, Reaches an 18-Month High in July; Home Price Growth Deceleration Begins to Level Off
Today, the Data & Analytics division of Black Knight, Inc. released its latest Mortgage Monitor Report, based upon the company’s industry-leading mortgage performance, housing and public records datasets. After 15 months of declining year-over-year home price growth, the company revisited the home affordability landscape. As Black Knight Data & Analytics President Ben Graboske explained, as a result of falling interest rates and slowing home price appreciation, affordability is the best it’s been in 18 months.
“For much of the past year and a half, affordability pressures have put a damper on home price appreciation,” said Graboske. “Indeed, the rate of annual home price growth has declined for 15 consecutive months. More recently, declining 30-year fixed interest rates have helped to ease some of those pressures, improving the affordability outlook considerably. In November 2018 – when rising interest rates hit a seven-year high and home price growth fell by half a percent in a single month – it took 23.3% of the median household income to make the principal and interest payments when purchasing the average-priced home. As 30-year rates fell to 3.75%, that share fell to 21.3%, the lowest it’s been in 18 months.
“This has changed the affordability landscape significantly. Whereas nine states were less affordable than their long-term norms back in November – a key driver behind the subsequent deceleration in home prices – only California and Hawaii remained so as of July. And despite the average home price rising by more than $12K since November, today’s lower fixed interest rates have worked out to a $108 lower monthly payment when purchasing the average-priced home with 20% down. Lower rates have also increased the buying power for prospective homebuyers looking to purchase the average-priced home by the equivalent of 15%, meaning that they could effectively buy $45,000 ‘more house’ while still keeping their payments the same as they would have been last fall. As affordability pressures have eased, it also appears to be putting the brakes on the home price deceleration we’ve been tracking since February 2018. After 15 consecutive monthly declines, the national home price growth rate for June stayed level from May at 3.78%.”
emphasis added
 Click on graph for larger image.
Here is a graph from the Mortgage Monitor that shows the National delinquency rate over time.
From Black Knight:
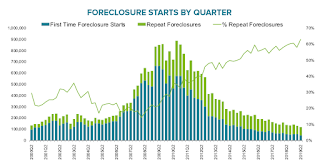
• June's nearly 11% jump in delinquencies was one of the top five such single-month increases in the past decade and one of the top 15 on record back to 2000The second graph shows foreclosure starts:
• However, while significant, it wasn’t unexpected given the seasonal and calendar-related pressures weighing on the market
• On average, over the past 20 years, the national delinquency rate has increased by 2.5% in June
• More impactful is that the month ended on a Sunday, which means servicing operations are closed on the last two calendar days of the month and cannot process last-minute payments
• June has ended on a Sunday three times in the past 20 years; the last two (2002 and 2013) saw an average monthly delinquency rate increase of 11.1%, nearly identical to this year
• Delinquencies tend to improve in the month following a Sunday month-end, which may help to counter the seasonal rise typically seen in July

• First-time foreclosure starts accounted for just 37% of all activity, marking the lowest such volume and share of foreclosure activity of any quarter on recordThere is much more in the mortgage monitor.
• A total of 120K foreclosure starts were initiated in Q2 2019, down 7% from Q1 and down 12% year-over-year, marking the lowest quarterly total since the turn of the century
• First-time foreclosure starts were down 20% year-over-year, while repeat foreclosures saw only a 7% decline


