by Calculated Risk on 8/30/2018 12:03:00 PM
Thursday, August 30, 2018
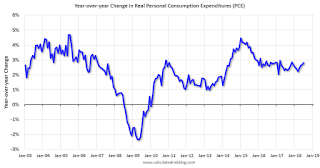
Year-over-year Change in Real Personal Consumption Expenditures (PCE)
Earlier I posted a graph showing real monthly personal consumption expenditures (PCE) based on the monthly BEA report.
Here is a graph showing the year-over-year change in real PCE since 2003.
In July, the YoY change was 2.8%, about the same level as for the last few years.

There was a significant decline in real PCE during the great recession, and real PCE was fairly weak during the first few years of the recovery - partially due to the ongoing weakness in housing following the housing bubble and bust.
More recently real PCE has been increasing at a fairly steady rate between 2.0% and 3.0% per year.


