by Calculated Risk on 8/04/2017 07:27:00 PM
Friday, August 04, 2017
AAR: Rail Traffic decreased slightly in July
From the Association of American Railroads (AAR) Rail Time Indicators. Graphs and excerpts reprinted with permission.
Total U.S. rail carloads were 0.6% lower in July 2017 than in July 2016. That’s not much, but it’s the first decline since October 2016. The end of easy comps for coal and grain gets much of the blame. For coal, carloads rose 4.0% in July, down from double-digit gains the previous six months. ... The biggest bright spots for rail traffic in July were carloads of crushed stone, gravel, and sand (up 15.0%, their sixth straight double-digit increase — thank frac sand) and intermodal (up 5.6%, keeping it on pace to set a new annual record this year). Carloads of petroleum products kept falling in July, as did carloads of motor vehicles and parts (consistent with declines in sales and production of cars and light trucks). Year-todate total carloads were up 5.4% through July; year-to-date intermodal was up 3.1%.
 Click on graph for larger image.
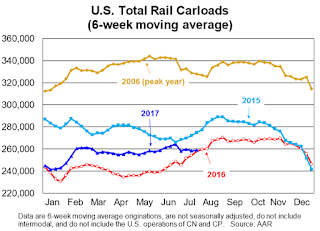
This graph from the Rail Time Indicators report shows U.S. average weekly rail carloads (NSA). Dark blue is 2017.
Rail carloads have been weak over the last decade due to the decline in coal shipments.
Last month we said that U.S. rail carloads were doing relatively well. Well, that was last month. Thanks in large part to much tougher comparisons, July’s carloads don’t look nearly as good. In July 2017, U.S. carload originations were 1,019,239, down 0.6% (6,079 carloads) from July 2016. It’s the first yearover-year monthly decrease for total carloads since October 2016, a span of eight months (see the chart below right). Average total weekly carloads in July 2017 of 254,810 were the lowest for July since sometime prior to 1988, when our records begin.
 The second graph is for intermodal traffic (using intermodal or shipping containers):
Unlike some rail carload categories, intermodal remains on track. U.S. intermodal originations were up 5.6% (55,997 containers and trailers) in July 2017 over July 2016. Weekly average originations of 264,589 in July 2017 were the second highest for July on record, behind July 2015.


