by Calculated Risk on 9/28/2016 12:52:00 PM
Wednesday, September 28, 2016
Update on "Peak Renter"
From economist Josh Lehner at Oregon Office of Economic Analysis Peak Renter In Real Life
A year ago our office asked “Is 2015 Peak Renter?” We laid out a straightforward case examining the three main underlying drivers for the shift into rentership over the past decade: household finances, demographics, and preferences and tastes. We know the pendulum has swung all the way toward rentership. The question is not whether or not it will swing back toward ownership, it will. The question is when will this happen. Our office’s position was that it would happen probably sooner than the conventional wisdom suggested. The reason was household finances and demographics are now working in favor of ownership.CR Note: there is much more in the post. When Lehner sent me his post last year, I added some comments here - including the following graph.
...
Well, the 2015 ACS data was just released and we got an update on the question of ownership vs rentership. As Jed Kolko notes in his great summary of the ACS data, rentership ticked up 0.1 percentage points nationwide last year. So not yet peak renter across the entire U.S. and the HVC data differ from the ACS data as well. That said, the U.S. changes were minimal, suggesting the shift into rentership has slowed considerably; possibly an indication that peak renter is near.
Locally, however, peak renter is already here. Statewide the homeownership rate ticked up from 60.7% in 2014 to 61.1% in 2015. In the Portland metro region the increase was even bigger at 1.6 percentage points.
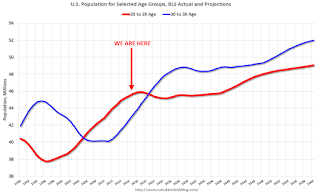
 Click on graph for larger image.
This graph shows the long term trend for two key age groups: 20 to 29, and 30 to 39.
This graph is from 1990 to 2060 (all data from BLS: current to 2060 is projected).
We can see the surge in the 20 to 29 age group (red). Once this group exceeded the peak in earlier periods, there was an increase in apartment construction. This age group will peak in 2018 (until the 2030s).
Note: I used a similar graph six years ago to argue there would be a surge in rentals from both demographics, and also from people losing their homes to foreclosure.
For buying, the 30 to 39 age group (blue) is important (note: see Demographics and Behavior for some reasons for changing behavior). The population in this age group is increasing, and will increase significantly over the next 10+ years.
This demographics is positive for home buying, and this is a key reason I expect single family housing starts to continue to increase in coming years.


