by Calculated Risk on 11/02/2015 09:38:00 AM
Monday, November 02, 2015
Black Knight September Mortgage Monitor
Black Knight Financial Services (BKFS) released their Mortgage Monitor report for September today. According to BKFS, 4.87% of mortgages were delinquent in September, up from 4.79% in August. BKFS reported that 1.46% of mortgages were in the foreclosure process, down from 1.89% in September 2014.
This gives a total of 6.33% delinquent or in foreclosure. It breaks down as:
• 2,457,000 properties that are 30 or more days delinquent, but not in foreclosure.
• 737,000 loans in foreclosure process.
For a total of 3,194,000 loans delinquent or in foreclosure in September. This is down from 3,800,000 in September 2014.
Press Release: Black Knight’s September Mortgage Monitor: Recent Surge in Purchase Originations Driven Primarily by High-Credit Borrowers
oday, the Data and Analytics division of Black Knight Financial Services, Inc. (NYSE: BKFS) released its latest Mortgage Monitor Report, based on data as of the end of September 2015. ...
“Purchase mortgage originations are up significantly in 2015,” said Graboske. “Q2 2015 purchase originations were up 15 percent from the same quarter in 2014. In June, we saw the highest level of purchase lending since June 2007 and early Q3 figures show purchase originations are up 11 percent from the same period last year. What’s striking about this rise, though, is that it’s being driven almost entirely by high-credit borrowers. Year-over-year comparisons of purchase originations from sub-700 credit score borrowers show that purchase volumes from lower-credit borrowers are actually flat to slightly down from last year’s levels. Only 20 percent of purchase loans originated in the past three months have gone to borrowers with credit scores below 700. That’s the lowest level we’ve seen in well over 10 years. The weighted average credit score for purchase mortgages has also hit an all-time high of about 755."
emphasis added
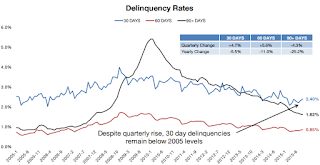
 Click on graph for larger image.
This graph from Black Knight shows the delinquency rates for the 30, 60 and 90 day buckets.
From Black Knight:
30-day and 60-day delinquencies saw quarterly increases due to market seasonality in Q3, rising 4.7 and 5.6 percent respectivelyThere is much more in the mortgage monitor.
Despite the Q3 rise in 30-day delinquencies, they remain below 2005’s pre-crisis levels; 60-day delinquencies remain slightly above 2005 levels
Positive movement continues in 90-day inventory, despite the seasonal inflow of new delinquencies, on both a quarterly and yearly basis
90-day delinquencies are down 25 percent over the past year


