by Calculated Risk on 8/25/2015 09:15:00 AM
Tuesday, August 25, 2015
Case-Shiller: National House Price Index increased 4.5% year-over-year in June
S&P/Case-Shiller released the monthly Home Price Indices for June ("June" is a 3 month average of April, May and June prices).
This release includes prices for 20 individual cities, two composite indices (for 10 cities and 20 cities) and the monthly National index.
Note: Case-Shiller reports Not Seasonally Adjusted (NSA), I use the SA data for the graphs.
From S&P: Home Prices Continue Upward Trend According to the S&P/Case-Shiller Home Price Indices
The S&P/Case-Shiller U.S. National Home Price Index, covering all nine U.S. census divisions, recorded a slightly higher year-over-year gain with a 4.5% annual increase in June 2015 versus a 4.4% increase in May 2015. The 10-City Composite had marginally lower year-over-year gains, with an increase of 4.6% year-over-year. The 20-City Composite year-over-year pace was virtually unchanged from last month, rising 5.0% year-over-year.
...
Before seasonal adjustment, the National index and 20-City Composite both reported gains of 1.0% month-over-month in June. The 10-City Composite posted a gain of 0.9% month-over-month. After seasonal adjustment, the National index posted a gain of 0.1% while the 10-City and 20-City Composites were both down 0.1% month-over-month. All 20 cities reported increases in June before seasonal adjustment; after seasonal adjustment, nine were down, nine were up, and two were unchanged.
...
“Nationally, home prices continue to rise at a 4-5% annual rate, two to three times the rate of inflation,” says David M. Blitzer, Managing Director and Chairman of the Index Committee at S&P Dow Jones Indices.
emphasis added
 Click on graph for larger image.
 The first graph shows the nominal seasonally adjusted Composite 10, Composite 20 and National indices (the Composite 20 was started in January 2000).
The Composite 10 index is off 14.6% from the peak, and down 0.2% in June (SA).
The Composite 20 index is off 13.3% from the peak, and down 0.1% (SA) in June.
The National index is off 7.5% from the peak, and up 0.1% (SA) in June. The National index is up 25.0% from the post-bubble low set in December 2011 (SA).
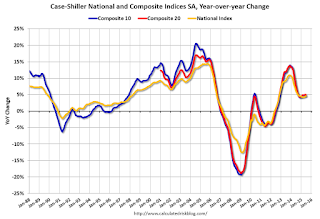
 The second graph shows the Year over year change in all three indices.
The Composite 10 SA is up 4.6% compared to June 2014.
The Composite 20 SA is up 5.0% year-over-year..
The National index SA is up 4.5% year-over-year.
Prices increased (SA) in 10 of the 20 Case-Shiller cities in June seasonally adjusted. (Prices increased in 20 of the 20 cities NSA) Prices in Las Vegas are off 39.5% from the peak, and prices in Denver and Dallas are at new highs (SA).
 The last graph shows the bubble peak, the post bubble minimum, and current nominal prices relative to January 2000 prices for all the Case-Shiller cities in nominal terms.
As an example, at the peak, prices in Phoenix were 127% above the January 2000 level. Then prices in Phoenix fell slightly below the January 2000 level, and are now up 51% above January 2000 (51% nominal gain in 15 years).
These are nominal prices, and real prices (adjusted for inflation) are up about 40% since January 2000 - so the increase in Phoenix from January 2000 until now is about 11% above the change in overall prices due to inflation.
Two cities - Denver (up 67% since Jan 2000) and Dallas (up 48% since Jan 2000) - are above the bubble highs (a few other Case-Shiller Comp 20 city are close - Boston, Charlotte, San Francisco, Portland). Detroit prices are barely above the January 2000 level.
This was close to the consensus forecast. I'll have more on house prices later.


