by Calculated Risk on 7/28/2015 10:16:00 AM
Tuesday, July 28, 2015
HVS: Q2 2015 Homeownership and Vacancy Rates
The Census Bureau released the Residential Vacancies and Homeownership report for Q2 2015.
This report is frequently mentioned by analysts and the media to track household formation, the homeownership rate, and the homeowner and rental vacancy rates. However, there are serious questions about the accuracy of this survey.
This survey might show the trend, but I wouldn't rely on the absolute numbers. The Census Bureau is investigating the differences between the HVS, ACS and decennial Census, and analysts probably shouldn't use the HVS to estimate the excess vacant supply or household formation, or rely on the homeownership rate, except as a guide to the trend.

The Red dots are the decennial Census homeownership rates for April 1st 1990, 2000 and 2010. The HVS homeownership rate decreased to 63.4% in Q2, from 63.7% in Q1.
I'd put more weight on the decennial Census numbers - and given changing demographics, the homeownership rate is probably close to a bottom.

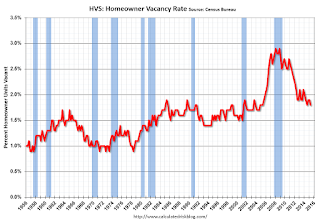
Are these homes becoming rentals?
Once again - this probably shows the general trend, but I wouldn't rely on the absolute numbers.

I think the Reis quarterly survey (large apartment owners only in selected cities) is a much better measure of the rental vacancy rate, but this does suggest the rental vacancy rate is the lowest in decades.
The quarterly HVS is the most timely survey on households, but there are many questions about the accuracy of this survey.


