by Calculated Risk on 2/03/2015 09:14:00 AM
Tuesday, February 03, 2015
CoreLogic: House Prices up 5.0% Year-over-year in December
Notes: This CoreLogic House Price Index report is for December. The recent Case-Shiller index release was for November. The CoreLogic HPI is a three month weighted average and is not seasonally adjusted (NSA).
From CoreLogic: Home Prices Up 5 Percent Year Over Year for December 2014
CoreLogic® ... today released its December 2014 CoreLogic Home Price Index (HPI®) which shows that home prices nationwide, including distressed sales, increased 5 percent in December 2014 compared to December 2013. This change represents 34 months of consecutive year-over-year increases in home prices nationally. On a month-over-month basis, home prices nationwide, including distressed sales, fell by 0.1 percent in December 2014 compared to November 2014.
Twenty-seven states and the District of Columbia are at or within 10 percent of their peak. Three states showed year-over-year home price depreciation, including distressed sales, in December; these states were Maryland (-0.7 percent), Vermont (-0.9 percent) and Connecticut (-2.2 percent).
Excluding distressed sales, home prices increased 4.9 percent in December 2014 compared to December 2013 and increased 0.1 percent month over month compared to November 2014. Distressed sales include short sales and real estate owned (REO) transactions....
“For the full year of 2014, home prices increased 7.4 percent, down from an 11.1-percent increase in 2013,” said Sam Khater, deputy chief economist at CoreLogic. “Nationally, home price growth moderated and stabilized at 5 percent the last four months of the year. The moderation can be clearly seen at the state level, with Colorado, Texas and New York at the high end of appreciation, ending the year with increases of about 8 percent. This contrasts with previous appreciation rates in the double digits—for instance, Nevada and California which experienced increases of more than 20 percent earlier in 2014.”
emphasis added
 Click on graph for larger image.
 This graph shows the national CoreLogic HPI data since 1976. January 2000 = 100.
The index was down 0.1% in November, and is up 5.0% over the last year.
This index is not seasonally adjusted, and this small month-to-month decrease was during the seasonally weak period.
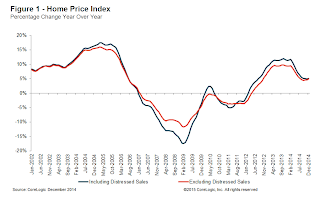
 The second graph is from CoreLogic. The year-over-year comparison has been positive for thirty four consecutive months suggesting house prices bottomed early in 2012 on a national basis (the bump in 2010 was related to the tax credit).
The YoY increases had been slowing, but has mostly moved sideways over the last four months.


