by Calculated Risk on 6/23/2014 12:05:00 PM
Monday, June 23, 2014
Comments on Existing Home Sales
The two key numbers in the existing home sales report right now are: 1) inventory, and 2) the percent of distressed sales.
The most important number in the report each month is inventory. This morning the NAR reported that inventory was up 6.0% year-over-year in May. This is a smaller increase than other sources suggest, and it is important to note that the NAR inventory data is "noisy" (and difficult to forecast based on other data). A few other points:
• The headline NAR inventory number is NOT seasonally adjusted (and there is a clear seasonal pattern).
• Inventory is still very low, and with the low level of inventory, there is still upward pressure on prices.
• I expect inventory to increase in 2014, and I expect the year-over-year increase to be in the 10% to 15% range by the end of 2014 (maybe even higher).
 Click on graph for larger image.
The NAR does not seasonally adjust inventory, even though there is a clear seasonal pattern. Trulia chief economist Jed Kolko sent me the seasonally adjusted inventory.
This shows that inventory bottomed in January 2013 (on a seasonally adjusted basis), and inventory is now up about 9.4% from the bottom. On a seasonally adjusted basis, inventory was up slightly in May compared to April.
Important: The NAR reports active listings, and although there is some variability across the country in what is considered active, many "contingent short sales" are not included. "Contingent short sales" are strange listings since the listings were frequently NEVER on the market (they were listed as contingent), and they hang around for a long time - they are probably more closely related to shadow inventory than active inventory. However when we compare inventory to 2005, we need to remember there were no "short sale contingent" listings in 2005. In the areas I track, the number of "short sale contingent" listings is also down sharply year-over-year.
Another key point: The NAR reported total sales were down 5.0% from May 2013, but normal equity sales were probably up from May 2013, and distressed sales down sharply. The NAR reported that 11% of sales were distressed in May (from a survey that is far from perfect):
Distressed homes – foreclosures and short sales – accounted for 11 percent of May sales, down from 18 percent in May 2013. Eight percent of May sales were foreclosures and three percent were short sales.Last year the NAR reported that 18% of sales were distressed sales.
A rough estimate: Sales in May 2013 were reported at 5.15 million SAAR with 18% distressed. That gives 927 thousand distressed (annual rate), and 4.22 million equity / non-distressed. In May 2014, sales were 4.89 million SAAR, with 11% distressed. That gives 538 thousand distressed - a decline of 42% from May 2013 - and 4.35 million equity. Although this survey isn't perfect, this suggests distressed sales were down sharply - and normal sales up slightly (even with less investor buying).
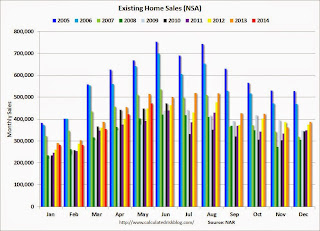
The following graph shows existing home sales Not Seasonally Adjusted (NSA).
 Click on graph for larger image.
Sales NSA in May (red column) were below the level of sales in May 2013, and above sales for 2008 through 2012.
Overall this report was a solid report.
Earlier:
• Existing Home Sales in May: 4.89 million SAAR, Inventory up 6.0% Year-over-year


