by Calculated Risk on 7/23/2013 05:24:00 PM
Tuesday, July 23, 2013
DataQuick: Q2 California Foreclosure Starts up from Q1, Down 52.9% from Q2 2012
From DataQuick: California Foreclosure Starts Up From First Quarter
While up from the first quarter, the number of California homeowners entering the foreclosure process was at its second-lowest level in seven years last quarter, largely the result of a steep rise in home values, a real estate information service reported.
Lenders filed 25,747 Notices of Default (NoDs) during the April-to-June period. That was up 38.7 percent from 18,568 for the previous quarter, and down 52.9 percent from 54,615 for second-quarter 2012, according to San Diego-based DataQuick.
The 18,568 NoDs filed in the first quarter of this year marked the lowest quarterly total since fourth-quarter 2005, when 15,337 NoDs were recorded. In addition to less distress in the housing market pipeline, this year's remarkably low first-quarter number mainly reflected policy and regulatory changes.
NoD filings plummeted early this year as a package of new state foreclosure laws - the "Homeowner Bill of Rights" - took effect on January 1. In California and other states in recent years foreclosure activity has sometimes plunged temporarily after a new law kicks in and the industry takes time to adjust.
Setting aside this year's first quarter, last quarter's NoD tally was the lowest since second-quarter 2006, when 20,909 NoDs were recorded. California NoDs peaked in first-quarter 2009 at 135,431. DataQuick's NoD statistics go back to 1992.
"At this point in the cycle, it's fairly straightforward to see what's going on. Just do the math - it's not calculus, it's 4th grade arithmetic. A foreclosure only makes sense when the home is worth less than what is owed on it. As home values rise, fewer homeowners owe more on their homes than the homes are worth," said John Walsh, DataQuick president.
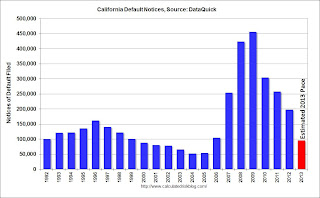
 Click on graph for larger image.
This graph shows the number of Notices of Default (NoD) filed in California each year. For 2013 (red), the bar is an estimated annual rate (since the California "Homeowner Bill of Rights" slowed foreclosure activity in Q1, the estimate rate is Q1 + 3 times Q2).
It looks like this will be the lowest year for foreclosure starts since 2005, and also below the levels in 1997 through 1999 when prices were rising following the much smaller housing bubble / bust in California.


