by Calculated Risk on 8/05/2012 01:08:00 PM
Sunday, August 05, 2012
Payroll Employment and Seasonal Factors
Brad Plummer at the WaPo discusses two issues with employment and seasonal factors: Wait, the U.S. economy actually lost 1.2 million jobs in July?
The U.S. economy lost 1.2 million jobs between June and July. But that’s not how it got reported. When the Bureau of Labor Statistics (BLS) released its jobs figures for July, it said the economy gained 163,000 jobs. So what gives?The first point that Plummer made was that there is a distinct seasonal pattern for employment. Even in the best of years there are a significant number of jobs lost in January and July. In 1994, when the economy added almost 3.9 million jobs, there were 2.25 million lost in January 1994, and almost 1 million payroll jobs lost in July 1994.
BLS isn’t hiding anything. The discrepancy just has to do with what’s known as “seasonal adjustments.” The U.S. economy follows certain predictable patterns in hiring and layoffs every year. School districts always let workers go for the summer and hire in the fall. Retailers always staff up for the Christmas holidays and lay people off afterwards. Students always flood the labor market in June.
So if we want to know how well the economy is doing, we want to know how many jobs were added after taking these predictable fluctuations into account. ...
In theory, that makes sense. But some economists and analysts now wonder if the BLS seasonal adjustments are somehow off a bit. If the financial crisis and recession mucked with the seasonal ebb and flow of the economy, then the adjustments that BLS makes for its monthly reports might be a bit skewed. Some jobs reports might look much better than they actually are. And others might look worse.
 Click on graph for larger image.
This graph shows the seasonal pattern for the last decade for both total nonfarm jobs and private sector only payroll jobs. Notice the large spike down every January.
In July, private sector hiring is weak, but the decline in non-farm payrolls is from the public sector (teacher layoffs). Usually those teachers return to the payrolls in September and early October.
Since this happens every year, the BLS applies a seasonal adjustment before reporting the headline number. The key point is this is a series that NEEDS a seasonal adjustment!
The second issue Plummer mentioned is that the seasonal factor might be off a little (skewed by the deep recession). It is possible that the BLS is understating employment every spring and early summer, and overstating employment in the fall and winter. I mentioned this possibility last week in the employment preview.
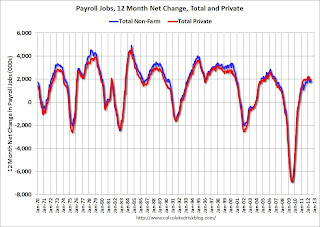
 One way to remove the seasonal factors is to look at the 12 month net change in payroll jobs. This graph shows the 12 month net change for both total employment and private employment.
Over the last 12 months, the economy has added 1.94 million private sector jobs, and 1.83 total non-farm payroll jobs (the public sector has lost 111 thousand jobs over the last 12 months).
Note that the red line has been above the blue line for the last few years - this is very unusual and is due to the decline in employment at all levels of government (especially state and local).
It is possible that the BLS overstated the strength of the labor market last winter, and understated the strength over the last several months (any seasonally skew could have been exaggerated this year by the mild winter). Of course the 12 month net change lags changes in the labor market - and that is why the BLS reports the seasonally adjusted payroll numbers.


