by Calculated Risk on 6/27/2012 11:57:00 AM
Wednesday, June 27, 2012
Housing: Inventory and Negative Equity
In the Pending Home Sales report this morning, the NAR analysts noted:
Low inventory results partly from underwater homeowners who are unwilling to list their homes, which would require a lengthy short sale process, or additional cash to complete the transaction. NAR estimates 85 percent of homeowners have positive equity, with 15 percent in an underwater situation.Zillow chief economist Stan Humphries has been discussing this: The Connection Between Negative Equity, Inventory Shortage and Increasing Home Values: Why the Bottom Won’t Be as Boring as We Expected
What markets like Miami and Phoenix may now be showing us is that negative equity has another very powerful effect on the supply side beyond increasing the flow of foreclosed homes onto the market: all the households that we predicted would be trapped in their homes and unable to buy new ones are similarly unable to sell their current homes, severely decreasing the overall supply of homes on the market.CR comment: Negative equity is probably contributing to the lower levels of inventory, but I think there are other factors too.
...
And negative equity may well be so constraining the supply side of the housing market that it’s creating acute inventory shortages that are bidding up prices.
...
What does all of this imply for the housing bottom? Our emerging hypothesis is that, instead of a long, flat bottom with price appreciation constrained by weak demand and elevated foreclosures, we might end up in an environment in which constrained supply (due to negative equity), together with robust demand from investors and first-time home buyers (not weighed down by negative equity), combine to create cycles of home value spikes followed by cooling periods. These cooling periods are created once local home values have risen enough to free some homeowners from negative equity at which point some of these resurfacing homeowners attempt to sell their homes, thus creating additional supply which tempers price appreciation.
One key is the substantial increase in investor owned single family homes. These are not "flippers", but cash flow investors - and these investors will not sell just because prices have risen a few percent (I've talked with some of these investors, and they many are making 8% to 12% cash-on-cash after expenses - and they have no intention of selling in the near term). Economist Tom Lawler discussed this back in February, and concluded that a significant "share of the decline in the share of homes for sale reflects the acquisition of SF (and condo) properties by investors as multi-year rental properties".
Another key driver of lower inventory is price expectations. As I noted: "When the expectation is that prices will fall further, marginal sellers will try to sell their homes immediately. And marginal buyers will decide to wait for a lower price. This leads to more inventory on the market. But when the expectation is that prices are stabilizing (the current situation), sellers will wait until it is convenient to sell."
So there are several factors pushing down inventory - and it looks like inventory was flat or declined in June too. The recent NAR report was for May; below are some numbers for June, and it is possible inventory has already peaked for the year.
According to the deptofnumbers.com for (54 metro areas), inventory is off 22.0% compared to June 2011. Unfortunately the deptofnumbers only started tracking inventory in April 2006.
This graph shows the NAR estimate of existing home inventory through May (left axis) and the HousingTracker data for the 54 metro areas through June.
 Click on graph for larger image.
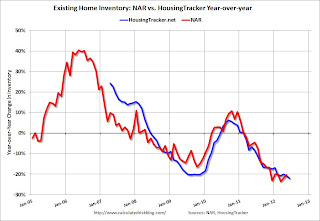
Since the NAR released their revisions for sales and inventory, the NAR and HousingTracker inventory numbers have tracked pretty well.
On a seasonal basis, housing inventory usually bottoms in December and January and then starts to increase again through the summer. So inventory still might increase a little over the next couple of months, but the forecasts for a "surge" in inventory this summer were clearly incorrect. It is even possible that inventory has already peaked for the year.
The second graph shows the year-over-year change in inventory for both the NAR and HousingTracker.
 HousingTracker reported that the June listings, for the 54 metro areas, declined 22.0% from the same month last year. So far in 2012, there has only been a small seasonal increase in inventory.
Whatever the reasons - negative equity, investor owned properties, "price expectations", or other reasons - this decline in active inventory remains a significant story.


