by Calculated Risk on 5/26/2012 01:02:00 PM
Saturday, May 26, 2012
Schedule for Week of May 27th
Earlier:
• Summary for Week Ending May 25th
The key report this week is the May employment report to be released on Friday.
Other key reports include the March Case-Shiller house price index on Tuesday, the second estimate for Q1 GDP on Thursday, and the April Personal Income and Outlays report on Friday.
Auto sales for May will also be released on Friday.
All US markets will be closed in observance of the Memorial Day holiday.
 9:00 AM: S&P/Case-Shiller House Price Index for March. Although this is the March report, it is really a 3 month average of January, February and March.
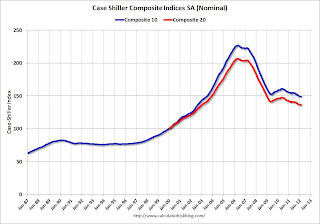
 This graph shows the nominal seasonally adjusted Composite 10 and Composite 20 indexes through February 2012 (the Composite 20 was started in January 2000).
The consensus is for a 2.7% decrease year-over-year in Composite 20 prices (NSA) in March. The Zillow forecast is for the Composite 20 to decline 2.6% year-over-year, and for prices to increase slightly month-to-month seasonally adjusted. I expect these indexes to be at new post-bubble lows, Not Seasonally Adjusted (NSA). The CoreLogic index increased 0.6% in March (NSA).
10:00 AM: Conference Board's consumer confidence index for May. The consensus is for an increase to 69.7 from 69.2 last month.
10:30 AM: Dallas Fed Manufacturing Survey for May. The consensus is for 3.0 for the general business activity index, up from -3.4 in April. This is the last of the regional Fed manufacturing surveys for May.
7:00 AM: The Mortgage Bankers Association (MBA) will release the mortgage purchase applications index. This index has been weak this year, although this does not include all the cash buyers.
10:00 AM ET: Pending Home Sales Index for April. The consensus is for a 0.5% increase in the index.
8:15 AM: The ADP Employment Report for May. This report is for private payrolls only (no government). The consensus is for 154,000 payroll jobs added in May, up from the 119,000 reported last month.
 8:30 AM: Q1 GDP (second estimate). This is the second estimate from the BEA. The consensus is that real GDP increased 1.9% annualized in Q1, slower than the advance estimate of 2.2%.
This graph shows the quarterly GDP growth (at an annual rate) for the last 30 years.
The Red column is the advance estimate for Q1 GDP.
8:30 AM: The initial weekly unemployment claims report will be released. The consensus is for claims to be unchanged at 370 thousand.
9:45 AM: Chicago Purchasing Managers Index for May. The consensus is for a decrease to 56.1, down from 56.2 in April.
11:00 AM: New York Fed to Release Q1 2012 Report on Household Debt and Credit.
 8:30 AM: Employment Report for May. The consensus is for an increase of 150,000 non-farm payroll jobs in May, up from the 115,000 jobs added in April.
The consensus is for the unemployment rate to remain unchanged at 8.1%.
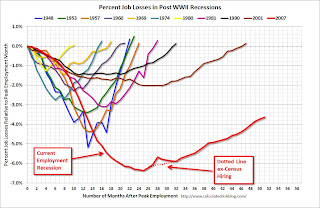
This second employment graph shows the percentage of payroll jobs lost during post WWII recessions through April.
 The economy has added 3.75 million jobs since employment bottomed in February 2010 (4.25 million private sector jobs added, and 502 thousand public sector jobs lost).
There are still 4.6 million fewer private sector jobs now than when the recession started in 2007. (5.0 million fewer total nonfarm jobs).
8:30 AM ET: Personal Income and Outlays for April. The consensus is for a 0.3% increase in personal income in April, and a 0.3% increase in personal spending, and for the Core PCE price index to increase 0.1%.
 10:00 AM ET: ISM Manufacturing Index for May.
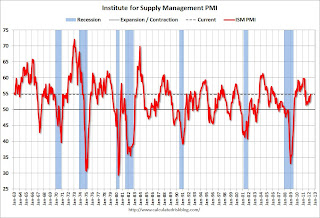
 Here is a long term graph of the ISM manufacturing index. The consensus is for a slight decrease to 54.0 from 54.8 in April. The regional Fed surveys were mixed this month. Also Markit has introduced a new "Flash PMI" for the US showing "the seasonally adjusted PMI falling from 56.0 in April to 53.9". This would suggest a larger decrease in the ISM index.
10:00 AM: Construction Spending for April. The consensus is for a 0.4% increase in construction spending.
All day: Light vehicle sales for May. Light vehicle sales are expected to increase to 14.5 million from 14.4 million in April (Seasonally Adjusted Annual Rate).
 This graph shows light vehicle sales since the BEA started keeping data in 1967. The dashed line is the April sales rate.
 TrueCar is forecasting:
The May 2012 forecast translates into a Seasonally Adjusted Annualized Rate (SAAR) of 14.5 million new car sales, up from 11.7 million in May 2011Edmund.com is forecasting:
Edmunds.com estimates that 1,391,163 new cars will be sold in May, for an estimated Seasonally Adjusted Annual Rate (SAAR) of 14.4 million. This would be a 17.5 percent increase from April 2012 and a 31.1 percent increase (unadjusted for number of selling days) from May 2011.


