by Calculated Risk on 2/25/2012 08:18:00 AM
Saturday, February 25, 2012
Summary for Week ending February 24th
There were few economic releases last week, but once again most of the data suggested some increase in economic activity. Of course the better than normal weather helped again, especially for housing.
The key economic release last week was new home sales. Although the Census Bureau report showed a small decline in sales from December, this was because December was revised up from a 307 thousand sales rate (Seasonally Adjusted Annual Rate) to 324 thousand. After averaging a 300 thousand sales rate for the 18 months following the expiration of the tax credit, new home sales have averaged a sales rate over 320 thousand for the last 3 months. Not much of an increase from a historical perspective, but it appears new home sales have bottomed. Of course it is just 3 months of better sales, and the critical selling months are coming up.
For existing home sales, the key number is inventory - and the NAR reported inventory declined 20.6% year-over-year in January. The sharp decline in inventory has lead to a scramble to explain the decline. Both Tom Lawler and I posted some thoughts on the decline (something we've been tracking all year, so we weren't surprised), see: Comments on Existing Home Inventory and Lawler: Declining Inventory of Existing Homes for Sale: Don’t Forget Conversion to Rentals
Other positive data included another drop in the four week average of initial weekly unemployment claims, an increase in consumer sentiment, and another positive reading for the Architecture Billings Index, and for manufacturing, an increase in Kansas City (10th District) manufacturing survey showing faster expansion in February.
Overall this was another solid week. Here is a summary in graphs:
• New Home Sales in January at 321,000 Annual Rate
 Click on graph for larger image.
The Census Bureau reports New Home Sales in January were at a seasonally adjusted annual rate (SAAR) of 321 thousand. This was down from a revised 324 thousand in December (revised up from 307 thousand).
The first graph shows New Home Sales vs. recessions since 1963. The dashed line is the current sales rate. This was below the revised December rate of 324,000 and is 3.5 percent above the January 2011 estimate of 310,000.
On inventory, according to the Census Bureau:
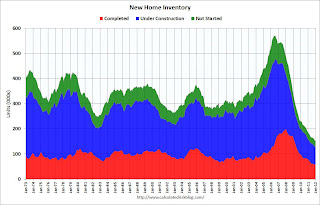
"A house is considered for sale when a permit to build has been issued in permit-issuing places or work has begun on the footings or foundation in nonpermit areas and a sales contract has not been signed nor a deposit accepted."Starting in 1973 the Census Bureau broke this down into three categories: Not Started, Under Construction, and Completed.
 This graph shows the three categories of inventory starting in 1973.
The inventory of completed homes for sale was at 57,000 units in January. The combined total of completed and under construction is at the lowest level since this series started.
This was above the consensus forecast of 315 thousand, and sales for October, November and December were revised up. With the record low levels of inventory, any pickup in sales should translate into more construction.
• Existing Home Sales in January: 4.57 million SAAR, 6.1 months of supply
The NAR reported: Existing-Home Sales Rise Again in January, Inventory Down
 This graph shows existing home sales, on a Seasonally Adjusted Annual Rate (SAAR) basis since 1993.
 Sales in January 2012 (4.57 million SAAR) were 4.3% higher than last month, and were 0.7% above the January 2011 rate.
But the key number in the report was inventory.
 The second graph shows nationwide inventory for existing homes.
According to the NAR, inventory decreased to 2.31 million in January from 2.32 million in December. This is the lowest level of inventory since March 2005.
The next graph shows the year-over-year (YoY) change in reported existing home inventory and months-of-supply.
 Since inventory is not seasonally adjusted, it really helps to look at the YoY change. Note: Months-of-supply is based on the seasonally adjusted sales and not seasonally adjusted inventory.
Inventory decreased 20.6% year-over-year in January from January 2011. This is the eleventh consecutive month with a YoY decrease in inventory.
Months of supply decreased to 6.1 months in January, down from 6.4 months in December.
• AIA: Architecture Billings Index indicated expansion in January
Note: This index is a leading indicator for new Commercial Real Estate (CRE) investment.
From AIA: Architecture Billings Index Remains Positive for Third Straight Month
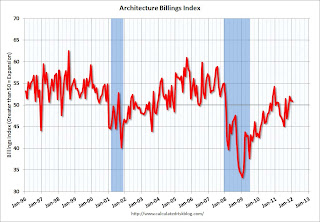
 This graph shows the Architecture Billings Index since 1996. The index was at 50.9 in January (slight expansion). Anything above 50 indicates expansion in demand for architects' services.
Note: This includes commercial and industrial facilities like hotels and office buildings, multi-family residential, as well as schools, hospitals and other institutions.
According to the AIA, there is an "approximate nine to twelve month lag time between architecture billings and construction spending" on non-residential construction. So this suggests further declines in CRE investment in early 2012, but perhaps stabilizing later in 2012.
• Weekly Initial Unemployment Claims unchanged at 351,000
 The DOL reports:
In the week ending February 18, the advance figure for seasonally adjusted initial claims was 351,000, unchanged from the previous week's revised figure of 351,000. The 4-week moving average was 359,000, a decrease of 7,000 from the previous week's revised average of 366,000.This graph shows the 4-week moving average of weekly claims since January 2000.
The dashed line on the graph is the current 4-week average. The four-week average of weekly unemployment claims decreased this week to 359,000.
The 4-week moving average is at the lowest level since early 2008.
Note: Nomura analysts argue some of the recent improvement is related to seasonal distortions, see Financial Times Alphaville: US jobs and seasonality: the DeLorean edition.
• Other Economic Stories ...
• From the Chicago Fed: Index shows economic growth in January again above average
• DOT: Vehicle Miles Driven increased 1.3% in December
• LPS: Number of delinquent mortgage loans declined in January, In foreclosure increases slightly
• Kansas City Fed: Tenth District Manufacturing Activity Increased Further in February


