by Calculated Risk on 11/04/2011 03:10:00 PM
Friday, November 04, 2011
Construction Employment: Down in October, up slightly in 2011
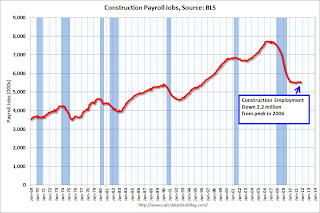
The graph below shows the number of total construction payroll jobs in the U.S. including both residential and non-residential since 1969.
Construction employment declined by 20 thousand jobs in October, and is now down 2.2 million jobs from the peak in April 2006. However construction employment is up 27 thousand this year through the October BLS report.
Unfortunately this graph is a combination of both residential and non-residential construction employment. The BLS only started breaking out residential construction employment fairly recently (residential specialty trade contractors in 2001).
 Click on graph for larger image.
Usually residential investment (and residential construction) lead the economy out of recession, and non-residential construction usually lags the economy. Because this graph is a blend, it masks the usual pickup in residential construction following previous recessions.
Construction employment is mostly moving sideways, but at least it is not a drag on employment and GDP this year - and that helps.
This table below shows the annual change in construction jobs (total, residential and non-residential) and through October for 2011.
| Annual Change in Payroll jobs (000s) | |||
|---|---|---|---|
| Year | Total Construction Jobs | Residential Construction Jobs | Non-Residential |
| 2002 | -85 | 88 | -173 |
| 2003 | 127 | 161 | -34 |
| 2004 | 290 | 230 | 60 |
| 2005 | 416 | 268 | 148 |
| 2006 | 152 | -62 | 214 |
| 2007 | -198 | -273 | 75 |
| 2008 | -787 | -510 | -277 |
| 2009 | -1053 | -431 | -622 |
| 2010 | -149 | -113 | -36 |
| Through October 2011 | 27 | 11 | 16 |
After five consecutive years of job losses for residential construction (and four years for total construction), it looks like construction employment will increase this year. However there will not be a strong increase in residential construction until the excess supply of housing is absorbed.
In addition residential investment has made a small positive contribution to GDP so far this year - for the first time since 2005.
Here are the earlier employment posts (with graphs):
• October Employment Report: 80,000 Jobs, 9.0% Unemployment Rate
• Employment Summary, Part Time Workers, and Unemployed over 26 Weeks
• Seasonal Retail Hiring, Duration of Unemployment, Unemployment by Education and Diffusion Indexes
• NEW Employment graph gallery (fast, no scripting)


