by Calculated Risk on 10/04/2011 04:00:00 PM
Tuesday, October 04, 2011
Market Update: Almost a new bear

Click on graph for larger image in new window.
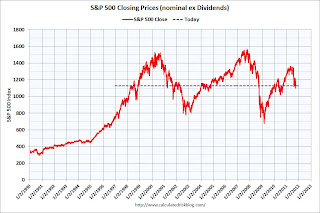
The first graph shows the S&P 500 since 1990 (this excludes dividends).
The dashed line is the closing price today. The S&P 500 was first at this level in April 1998; over 13 years ago.
The second graph (click on graph for larger image) from Doug Short shows the sharp decline over the last few weeks.
The S&P dipped into bear market territory (down 20%) within the day, but closed up over 2%. This puts the S&P500 down about 17.5% from the recent peak.


