by Calculated Risk on 5/10/2011 10:09:00 AM
Tuesday, May 10, 2011
CoreLogic: House Prices declined 1.5% in March, Prices now 4.6% below 2009 Lows
Notes: Case-Shiller is the most followed house price index, but CoreLogic is used by the Federal Reserve and is followed by many analysts. CoreLogic reports the year-over-year change each month, and the headline for this post is for the change from February to March 2011. The CoreLogic HPI is a three month weighted average of January, February and March, and is not seasonally adjusted (NSA).
From CoreLogic: CoreLogic® Home Price Index Shows Year-Over-Year Decline for 8th Straight Month
CoreLogic ... today released its March Home Price Index (HPI) which shows that home prices in the U.S. declined for the eight month in a row. According to the CoreLogic HPI, national home prices, including distressed sales, declined by 7.5% in March 2011 compared to March 2010. ... Excluding distressed sales, year-over-year priced declined by 0.96 percent in March 2011 compared to March 2010.
 Click on graph for larger image in graph gallery.
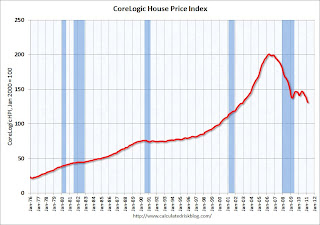
 This graph shows the national CoreLogic HPI data since 1976. January 2000 = 100.
The index is down 7.5% over the last year, and off 34.8% from the peak.
This is the eight straight month of year-over-year declines, and the ninth straight month of month-to-month declines. The index is now 4.6% below the previous post-bubble low set in March 2009, and I expect to see further new post-bubble lows for this index over the next few months.


